

Beyond element-wise interactions: identifying complex interactions in biological processes
- PMID: 19774090
- PMCID: PMC2746320
- DOI: 10.1371/journal.pone.0006899
Beyond element-wise interactions: identifying complex interactions in biological processes
Abstract
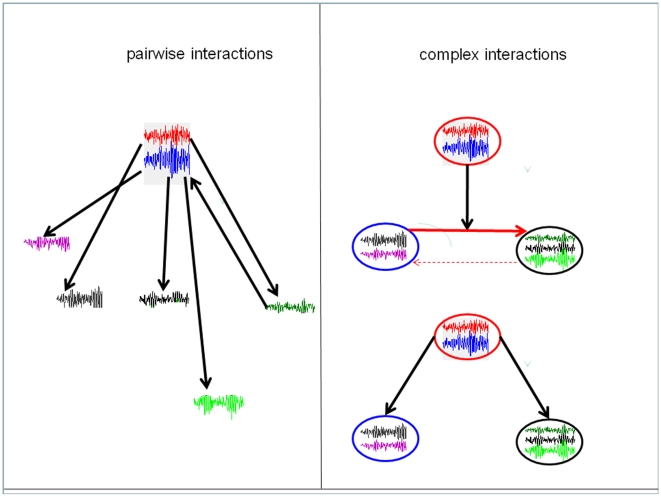
Background: Biological processes typically involve the interactions of a number of elements (genes, cells) acting on each others. Such processes are often modelled as networks whose nodes are the elements in question and edges pairwise relations between them (transcription, inhibition). But more often than not, elements actually work cooperatively or competitively to achieve a task. Or an element can act on the interaction between two others, as in the case of an enzyme controlling a reaction rate. We call "complex" these types of interaction and propose ways to identify them from time-series observations.
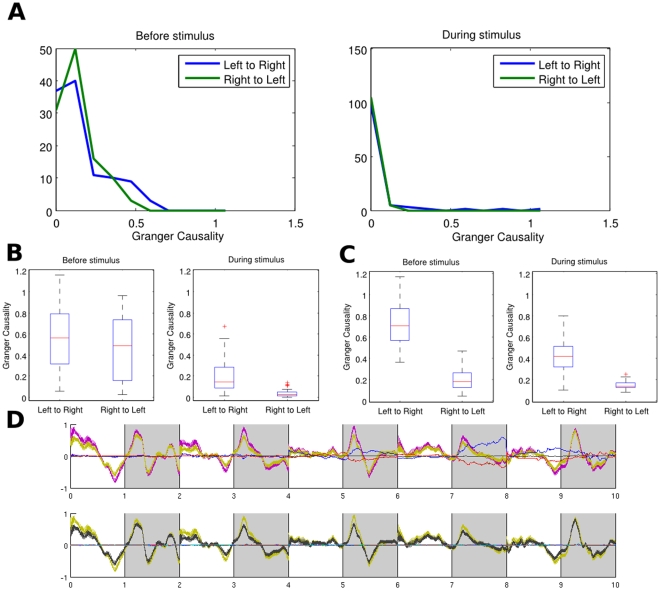
Methodology: We use Granger Causality, a measure of the interaction between two signals, to characterize the influence of an enzyme on a reaction rate. We extend its traditional formulation to the case of multi-dimensional signals in order to capture group interactions, and not only element interactions. Our method is extensively tested on simulated data and applied to three biological datasets: microarray data of the Saccharomyces cerevisiae yeast, local field potential recordings of two brain areas and a metabolic reaction.
Conclusions: Our results demonstrate that complex Granger causality can reveal new types of relation between signals and is particularly suited to biological data. Our approach raises some fundamental issues of the systems biology approach since finding all complex causalities (interactions) is an NP hard problem.
Conflict of interest statement
Figures
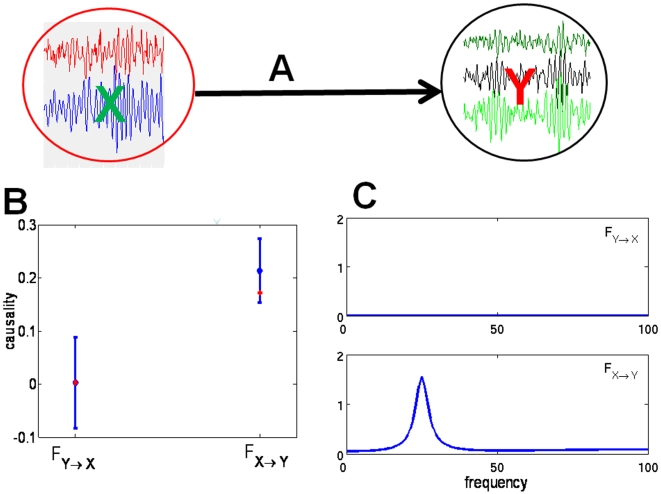
 confidence interval after 1000 replications are shown in blue. The summation over a frequency range of the corresponding frequency-domain formulation is shown in red. (C) the corresponding spectra in the frequency domain.
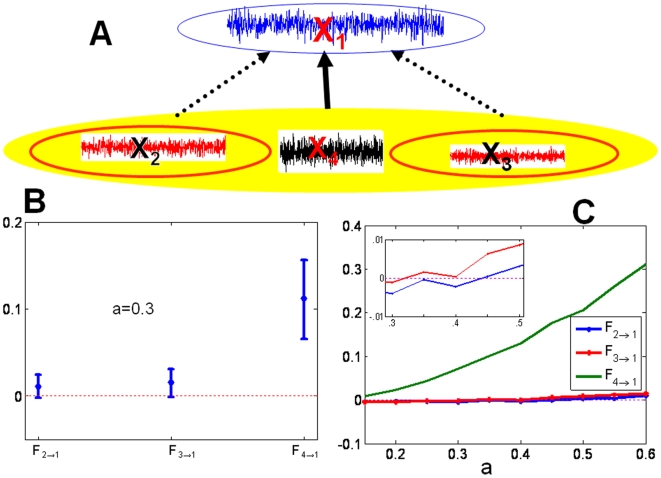
 with
with  . (B) The average value and its confidence interval of the Granger causality in example 2 when
  . There are no causal relations between
  and
and  , and
, and  and
and  , but the causal relationship between
  and
and  is significant. (C) The lowest value of the confidence intervals as a function of
  . The inset shows the increasing, as one would expect, values of
  and
and  but on too small a scale to be significant.
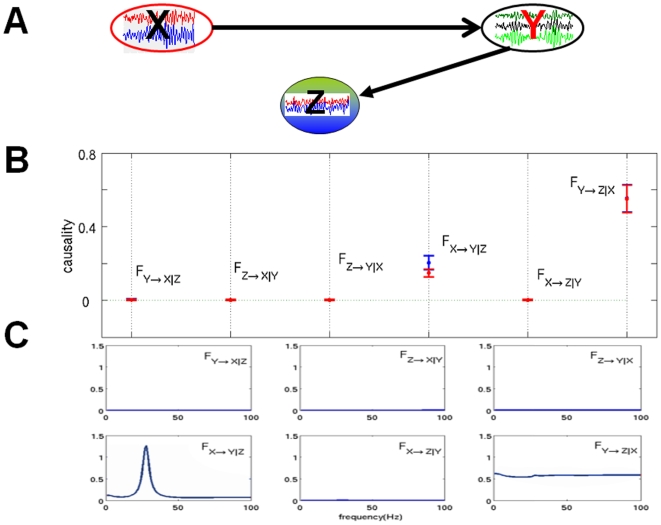
 and
and  are multi-dimensional. (B) Blue and red error bars are defined as in figure 2. (C) Corresponding spectra in the frequency domain. The partial complex Granger causality and its 95
 confidence intervals after 1000 replications.
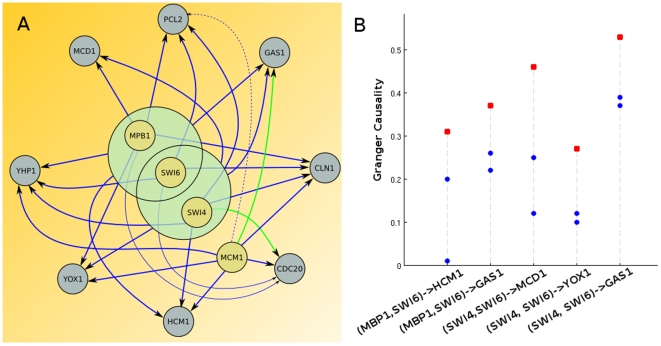
 and
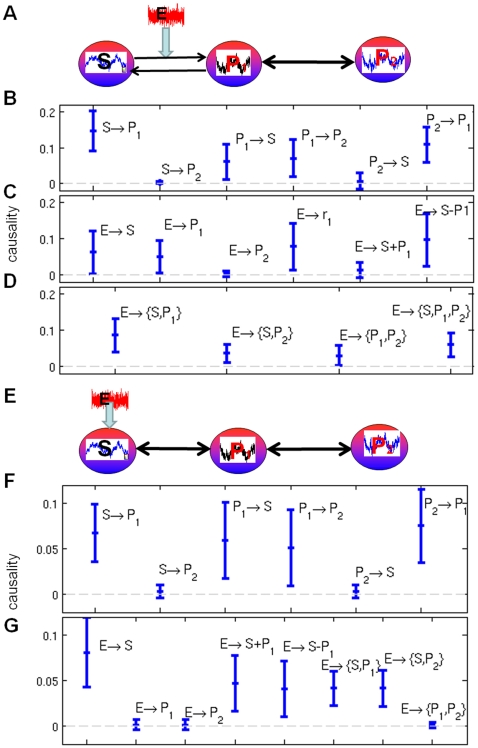
and  in Example 4. The enzyme
  has direct influence on the reaction rate
  . (B): Partial Granger causality between three reactants
  and
and  in Example 4. (C): Partial Granger causality from
  to other reactants in Example 4. (D): Partial Granger causality from
  to complex of
  in Example 4. (E): Time course of the three reactant
  and
and  in Example 5. In this example, the enzyme
  has direct influence on S. (F): Partial Granger causality between three substance
  and
and  in example 5. (G): Partial Granger causality from
  to other reactants and groups
  in example 5.
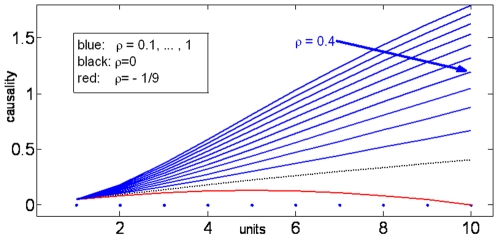
 with a = 0.022.(
 is the smallest possible value for the cross-correlations of 10 units.)
Similar articles
-
Quantitative inference of dynamic regulatory pathways via microarray data.BMC Bioinformatics. 2005 Mar 7;6:44. doi: 10.1186/1471-2105-6-44. BMC Bioinformatics. 2005. PMID: 15748298 Free PMC article.
-
Inferring network interactions within a cell.Brief Bioinform. 2005 Dec;6(4):380-9. doi: 10.1093/bib/6.4.380. Brief Bioinform. 2005. PMID: 16420736 Review.
-
Improved recovery of cell-cycle gene expression in Saccharomyces cerevisiae from regulatory interactions in multiple omics data.BMC Genomics. 2020 Feb 13;21(1):159. doi: 10.1186/s12864-020-6554-8. BMC Genomics. 2020. PMID: 32054475 Free PMC article.
-
Transcriptional regulatory networks in Saccharomyces cerevisiae.Science. 2002 Oct 25;298(5594):799-804. doi: 10.1126/science.1075090. Science. 2002. PMID: 12399584
-
Omics analysis of acetic acid tolerance in Saccharomyces cerevisiae.World J Microbiol Biotechnol. 2017 May;33(5):94. doi: 10.1007/s11274-017-2259-9. Epub 2017 Apr 12. World J Microbiol Biotechnol. 2017. PMID: 28405910 Review.
Cited by
-
Gene regulatory network discovery using pairwise Granger causality.IET Syst Biol. 2013 Oct;7(5):195-204. doi: 10.1049/iet-syb.2012.0063. IET Syst Biol. 2013. PMID: 24067420 Free PMC article.
-
Reconstructing higher-order interactions in coupled dynamical systems.Nat Commun. 2024 Jun 18;15(1):5184. doi: 10.1038/s41467-024-49278-x. Nat Commun. 2024. PMID: 38890277 Free PMC article.
-
A novel extended Granger Causal Model approach demonstrates brain hemispheric differences during face recognition learning.PLoS Comput Biol. 2009 Nov;5(11):e1000570. doi: 10.1371/journal.pcbi.1000570. Epub 2009 Nov 20. PLoS Comput Biol. 2009. PMID: 19936225 Free PMC article.
-
Identifying interactions in the time and frequency domains in local and global networks - A Granger Causality Approach.BMC Bioinformatics. 2010 Jun 21;11:337. doi: 10.1186/1471-2105-11-337. BMC Bioinformatics. 2010. PMID: 20565962 Free PMC article.
-
Macroeconomic factors and frequency domain causality between Gold and Silver returns in India.Resour Policy. 2020 Oct;68:101744. doi: 10.1016/j.resourpol.2020.101744. Epub 2020 Jun 30. Resour Policy. 2020. PMID: 34173414 Free PMC article.
References
-
- Eichler M. Schelter B, Winterhalder M, Timmer J, editors. Graphical modelling of dynamic relationships in multivariate time series. Handbook of Time Series Analysis, Wiley-VCH Verlage. 2006. pp. 335–372.
-
- Granger CWJ. Investigating causal relations by econometric models and cross-spectral methods. Econometrica. 1969;37:424–438.
-
- Granger C. Testing for causality a personal viewpoint. Journal of Economic Dynamics and Control. 1980;2:329–352.
-
- Pearl J. Causality: Models, Reasoning, and Inference. 2000. Cambridge University Press.
-
- Gourévitch B, Bouquin-Jeannès R, Faucon G. Linear and nonlinear causality between signals: methods, examples and neurophysiological applications. Biological Cybernetics. 2006;95:349–369. - PubMed
Publication types
MeSH terms
Substances
LinkOut - more resources
Full Text Sources
Molecular Biology Databases
Miscellaneous
