

Aberrant regulation of choline metabolism by mitochondrial electron transport system inhibition in neuroblastoma cells
- PMID: 19774105
- PMCID: PMC2747765
- DOI: 10.1007/s11306-008-0125-3
Aberrant regulation of choline metabolism by mitochondrial electron transport system inhibition in neuroblastoma cells
Abstract
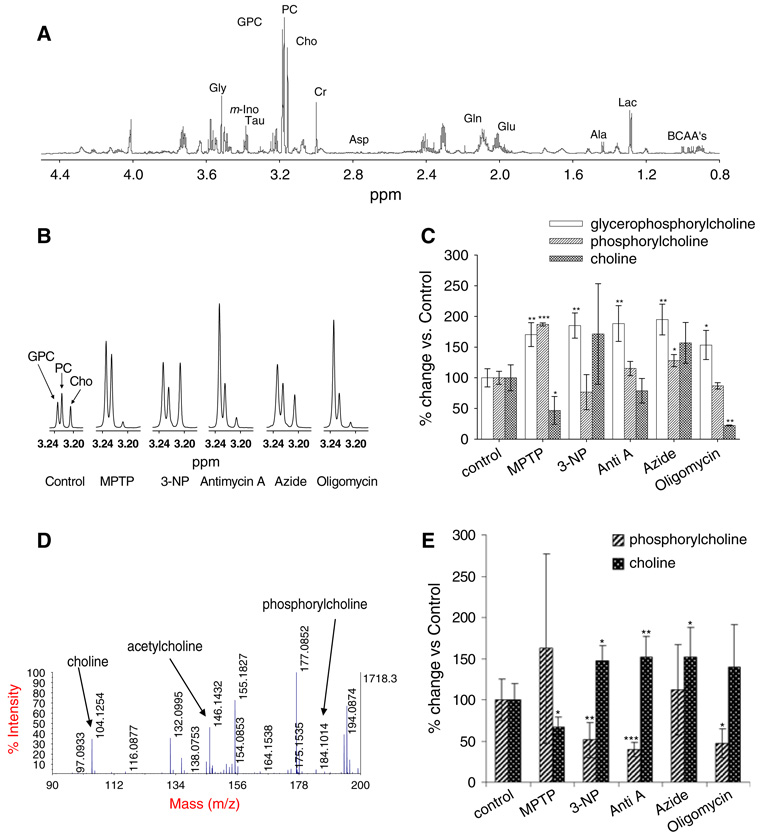
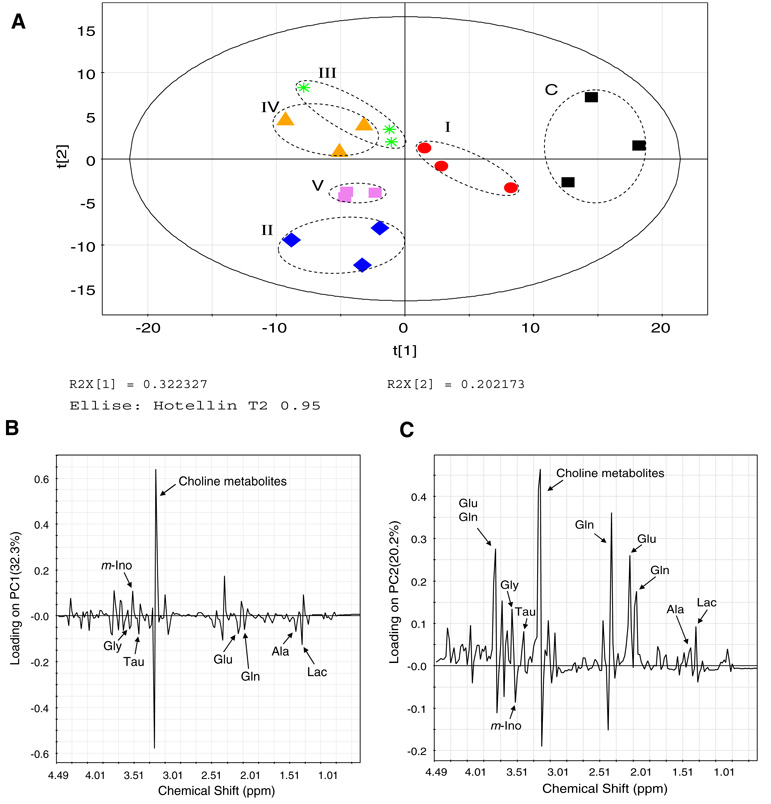
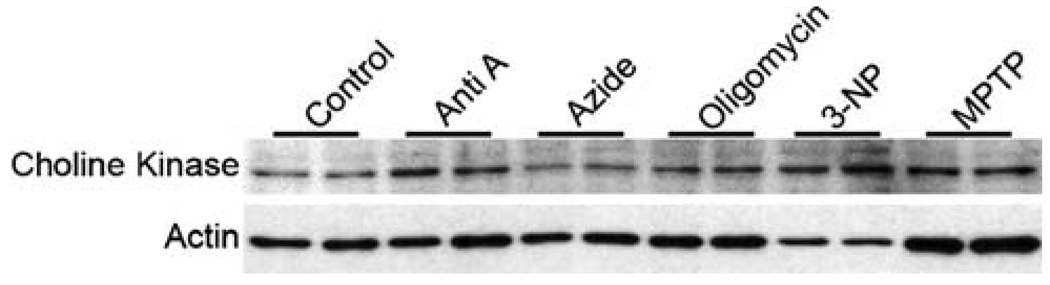
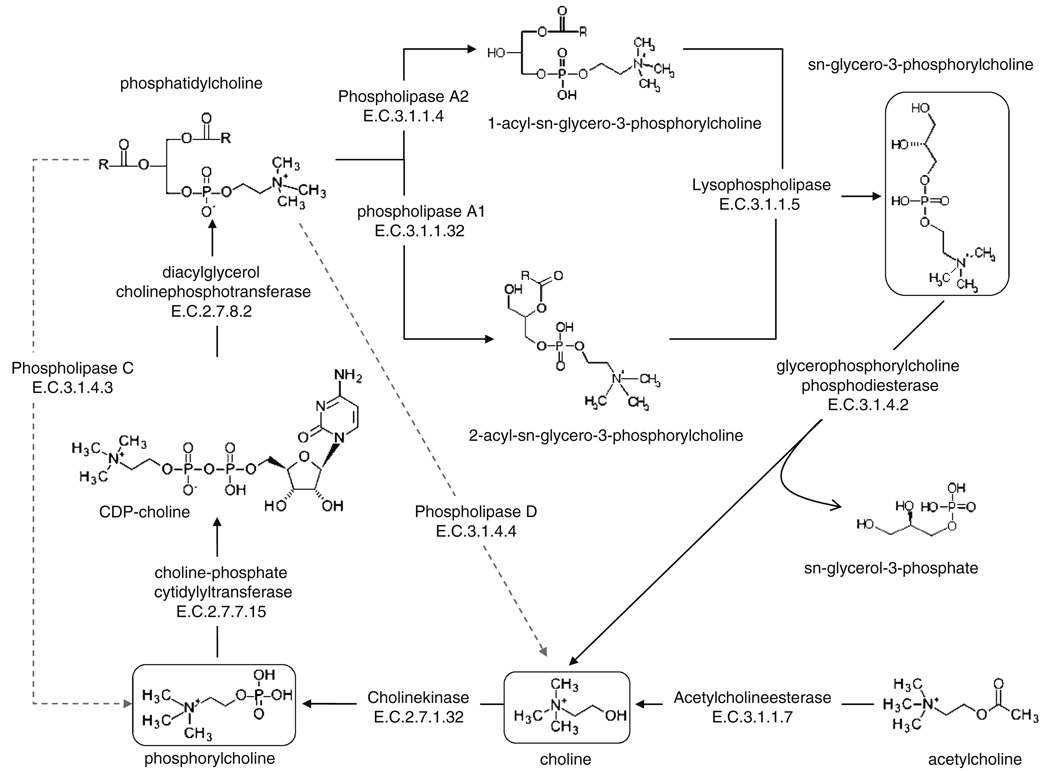
Anomalous choline metabolic patterns have been consistently observed in vivo using Magnetic Resonance Spectroscopy (MRS) analysis of patients with neurodegenerative diseases and tissues from cancer patient. It remains unclear; however, what signaling events may have triggered these choline metabolic aberrancies. This study investigates how changes in choline and phospholipid metabolism are regulated by distinct changes in the mitochondrial electron transport system (ETS). We used specific inhibitors to down regulate the function of individual protein complexes in the ETS of SH-SY5Y neuroblastoma cells. Interestingly, we found that dramatic elevation in the levels of phosphatidylcholine metabolites could be induced by the inhibition of individual ETS complexes, similar to in vivo observations. Such interferences produced divergent metabolic patterns, which were distinguishable via principal component analysis of the cellular metabolomes. Functional impairments in ETS components have been reported in several central nervous system (CNS) diseases, including Alzheimer's disease (AD) and Parkinson's disease (PD); however, it remains largely unknown how the suppression of individual ETS complex function could lead to specific dysfunction in different cell types, resulting in distinct disease phenotypes. Our results suggest that the inhibition of each of the five ETS complexes might differentially regulate phospholipase activities within choline metabolic pathways in neuronal cells, which could contribute to the overall understanding of mitochondrial diseases.
Figures
Similar articles
-
Metabolomic analysis revealed mitochondrial dysfunction and aberrant choline metabolism in MPP+-exposed SH-SY5Y cells.Biochem Biophys Res Commun. 2019 Nov 12;519(3):540-546. doi: 10.1016/j.bbrc.2019.09.031. Epub 2019 Sep 16. Biochem Biophys Res Commun. 2019. PMID: 31537380
-
17-allyamino-17-demethoxygeldanamycin treatment results in a magnetic resonance spectroscopy-detectable elevation in choline-containing metabolites associated with increased expression of choline transporter SLC44A1 and phospholipase A2.Breast Cancer Res. 2010;12(5):R84. doi: 10.1186/bcr2729. Epub 2010 Oct 14. Breast Cancer Res. 2010. PMID: 20946630 Free PMC article.
-
Antagonism of the Muscarinic Acetylcholine Type 1 Receptor Enhances Mitochondrial Membrane Potential and Expression of Respiratory Chain Components via AMPK in Human Neuroblastoma SH-SY5Y Cells and Primary Neurons.Mol Neurobiol. 2022 Nov;59(11):6754-6770. doi: 10.1007/s12035-022-03003-1. Epub 2022 Aug 25. Mol Neurobiol. 2022. PMID: 36002781 Free PMC article.
-
Cellular and molecular mechanisms underlying perturbed energy metabolism and neuronal degeneration in Alzheimer's and Parkinson's diseases.Ann N Y Acad Sci. 1999;893:154-75. doi: 10.1111/j.1749-6632.1999.tb07824.x. Ann N Y Acad Sci. 1999. PMID: 10672236 Review.
-
CDP-choline: pharmacological and clinical review.Methods Find Exp Clin Pharmacol. 1995 Oct;17 Suppl B:1-54. Methods Find Exp Clin Pharmacol. 1995. PMID: 8709678 Review.
Cited by
-
Alterations in energy/redox metabolism induced by mitochondrial and environmental toxins: a specific role for glucose-6-phosphate-dehydrogenase and the pentose phosphate pathway in paraquat toxicity.ACS Chem Biol. 2014 Sep 19;9(9):2032-48. doi: 10.1021/cb400894a. Epub 2014 Jul 7. ACS Chem Biol. 2014. PMID: 24937102 Free PMC article.
-
Multimodal mass spectrometric imaging of small molecules reveals distinct spatio-molecular signatures in differentially metastatic breast tumor models.Cancer Res. 2010 Nov 15;70(22):9012-21. doi: 10.1158/0008-5472.CAN-10-0360. Epub 2010 Nov 2. Cancer Res. 2010. PMID: 21045154 Free PMC article.
-
Choline kinase alpha-Putting the ChoK-hold on tumor metabolism.Prog Lipid Res. 2016 Jul;63:28-40. doi: 10.1016/j.plipres.2016.03.005. Epub 2016 Apr 9. Prog Lipid Res. 2016. PMID: 27073147 Free PMC article. Review.
-
Multi-Omics Integration in Mice With Parkinson's Disease and the Intervention Effect of Cyanidin-3-O-Glucoside.Front Aging Neurosci. 2022 Apr 29;14:877078. doi: 10.3389/fnagi.2022.877078. eCollection 2022. Front Aging Neurosci. 2022. PMID: 35572129 Free PMC article.
-
Changes in the NMR Metabolic Profile of Live Human Neuron-Like SH-SY5Y Cells Exposed to Interferon-α2.J Neuroimmune Pharmacol. 2016 Mar;11(1):142-52. doi: 10.1007/s11481-015-9641-x. Epub 2015 Nov 5. J Neuroimmune Pharmacol. 2016. PMID: 26541470
References
-
- Aboagye EO, Bhujwalla ZM. Malignant transformation alters membrane choline phospholipid metabolism of human mammary epithelial cells. Cancer Research. 1999;59:80–84. - PubMed
-
- Barker PB, Glickson JD, Bryan RN. In vivo magnetic resonance spectroscopy of human brain tumors. Topics in Magnetic Resonance Imaging. 1993;5:32–45. doi: 10.1097/00002142-199300520-00006. - DOI - PubMed
-
- Beal MF. Mitochondrial dysfunction in neurodegenerative diseases. Biochimica et Biophysica Acta. 1998;1366:211–223. doi: 10.1016/S0005-2728(98)00114-5. - DOI - PubMed
Grants and funding
LinkOut - more resources
Full Text Sources
Other Literature Sources