

Heterogeneity of non-cycling and cycling synchronized murine hematopoietic stem/progenitor cells
- PMID: 19774557
- PMCID: PMC4205963
- DOI: 10.1002/jcp.21918
Heterogeneity of non-cycling and cycling synchronized murine hematopoietic stem/progenitor cells
Abstract
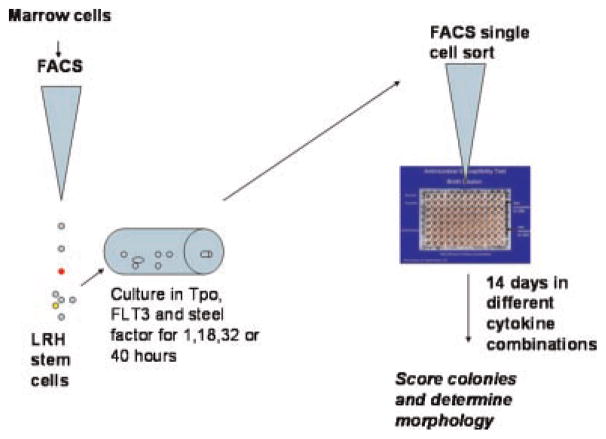
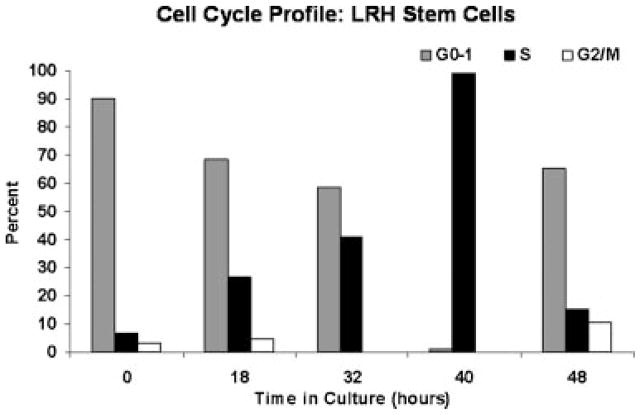
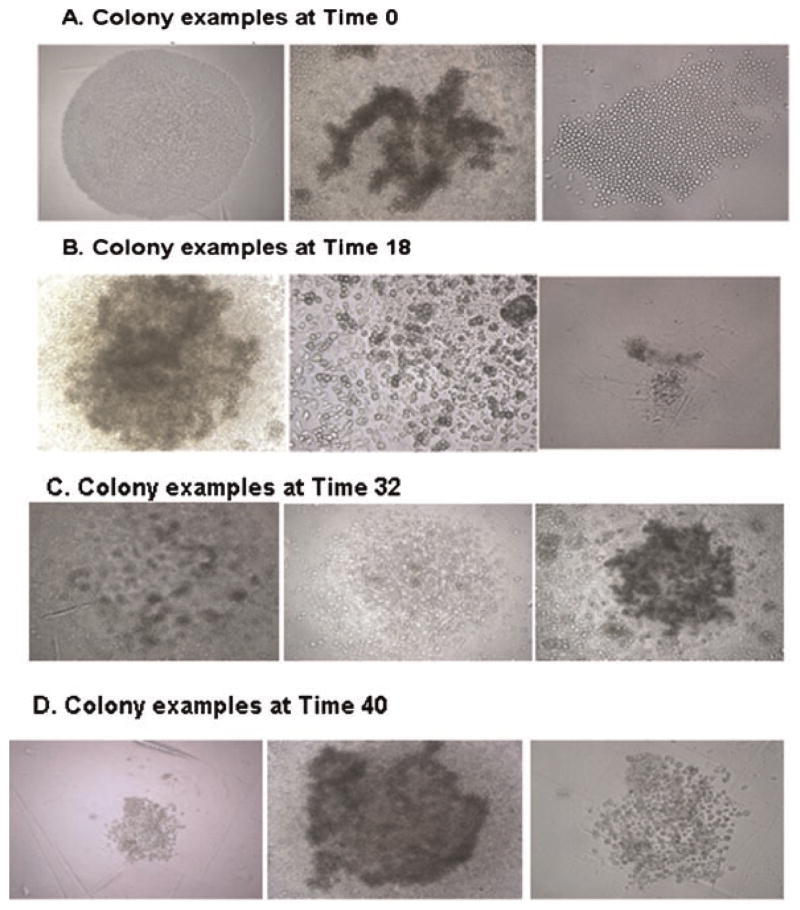
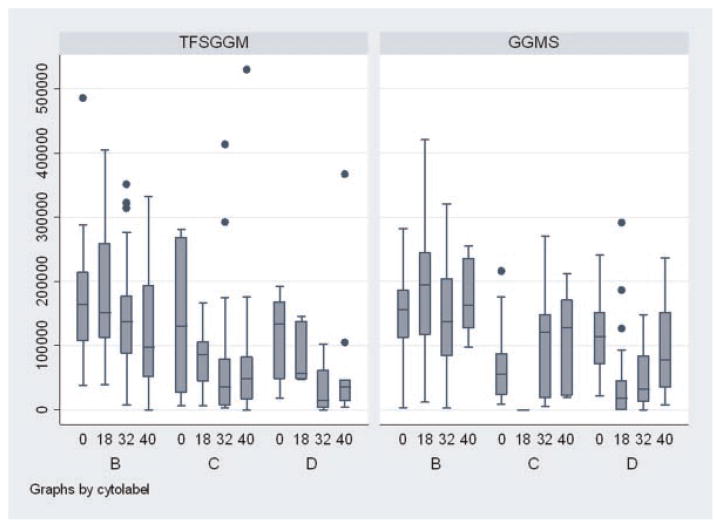
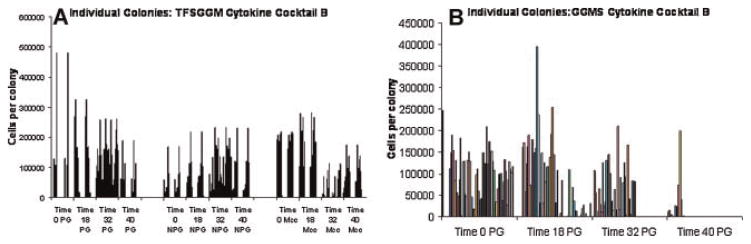
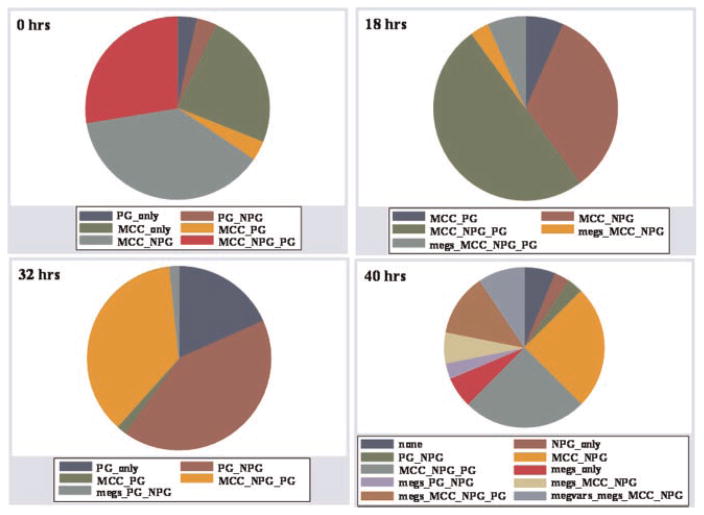
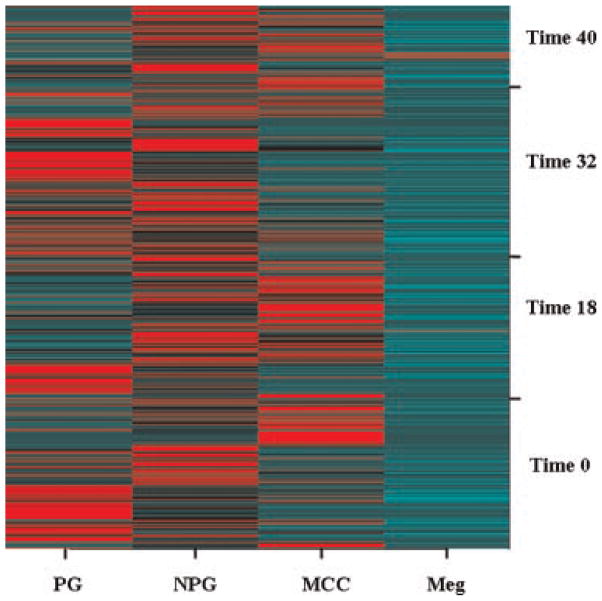
Purified long-term multilineage repopulating marrow stem cells have been considered to be homogenous, but functionally these cells are heterogeneous. Many investigators urge clonal studies to define stem cells but, if stem cells are truly heterogeneous, clonal studies can only define heterogeneity. We have determined the colony growth and differentiation of individual lineage negative, rhodamine low, Hoechst low (LRH) stem cells at various times in cytokine culture, corresponding to specific cell cycle stages. These highly purified and cycle synchronized (98% in S phase at 40 h of culture) stem cells were exposed to two cytokine cocktails for 0, 18, 32, or 40 h and clonal differentiation assessed 14 days later. Total heterogeneity as to gross colony morphology and differentiation stage was demonstrated. This heterogeneity showed patterns of differentiation at different cycle times. These data hearken to previous suggestions that stem cells might be similar to radioactive isotopes; decay rate of a population of radioisotopes being highly predictable, while the decay of individual nuclei is heterogeneous and unpredictable (Till et al., 1964). Marrow stem cells may be most adequately defined on a population basis; stem cells existing in a continuum of reversible change rather than a hierarchy.
Figures
References
-
- Abkowitz JL, Golinelli D, Harrison DE, Guttorp P. In vivo kinetics of murine hemopoietic stem cells. Blood. 2000;96:3399–3405. - PubMed
-
- Becker PS, Nilsson SK, Li Z, Berrios VM, Dooner MS, Cooper CL, Hsieh CC, Quesenberry PJ. Adhesion receptor expression by hematopoietic cell lines and murine progenitors: Modulation by cytokines and cell cycle status. Exp Hematol. 1999;27:533–541. - PubMed
-
- Berrios VM, Dooner GJ, Nowakowski G, Frimberger A, Valinski H, Quesenberry PJ, Becker PS. The molecular basis for the cytokine-induced defect in homing and engraftment of hematopoietic stem cells. Exp Hematol. 2001;29:1326–1335. - PubMed
-
- Bertoncello I, Bradley TR, Hodgson ES, Dunlop JM. The resolution, enrichment, and organization of normal bone marrow high proliferative potential colony-forming cell subsets on the basis of rhodamine-123 fluorescence. Exp Hematol. 1991;19:174–178. - PubMed
-
- Bradford GB, Williams B, Rossi R, Bertoncello I. Quiescence, cycling, and turnover in the primitive hematopoietic stem cell compartment. Exp Hematol. 1997;25:445–453. - PubMed
Publication types
MeSH terms
Substances
Grants and funding
LinkOut - more resources
Full Text Sources
Medical
