. 2009 Nov;74(3):691-706.
doi: 10.1111/j.1365-2958.2009.06891.x. Epub 2009 Sep 22.

Regulation of the type IV pili molecular machine by dynamic localization of two motor proteins

Affiliations
Free PMC article

Regulation of the type IV pili molecular machine by dynamic localization of two motor proteins

Iryna Bulyha et al. Mol Microbiol. 2009 Nov.
Free PMC article

Abstract

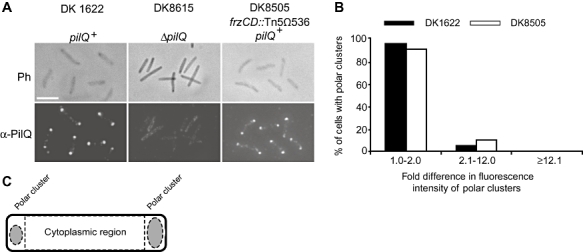
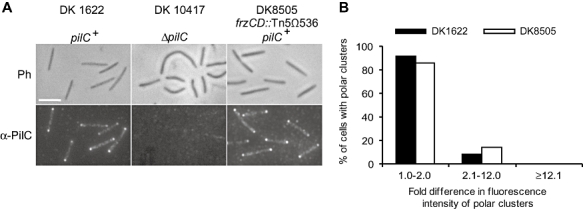
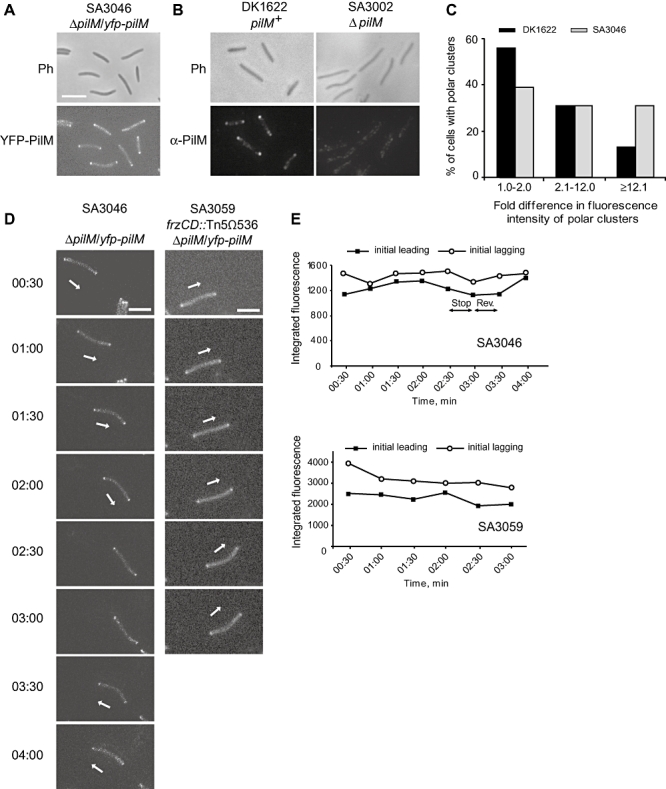
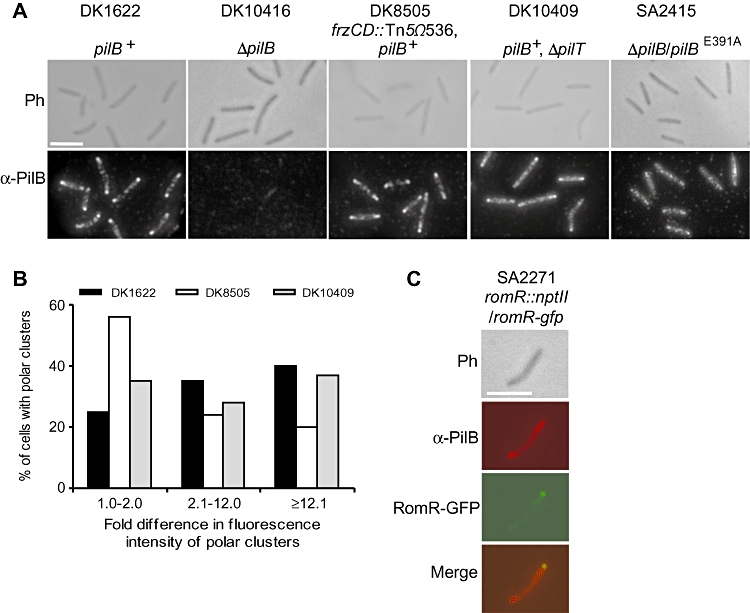
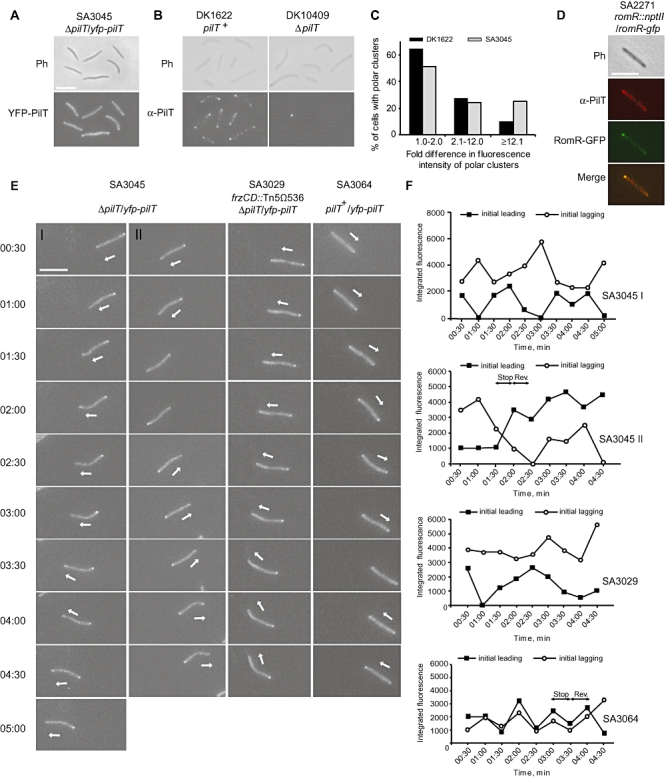
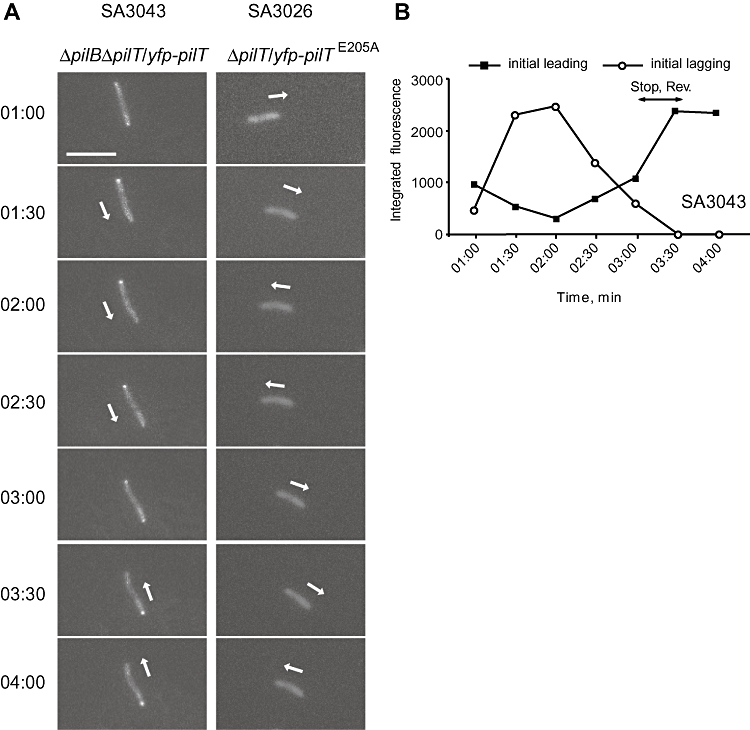
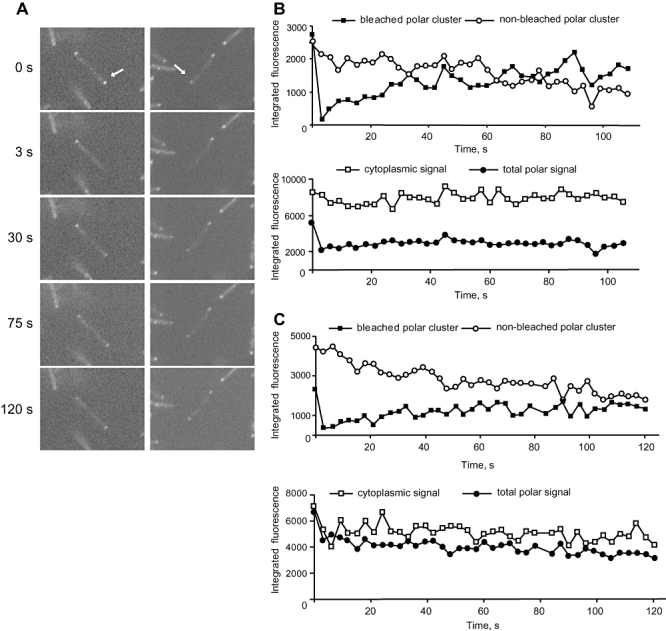
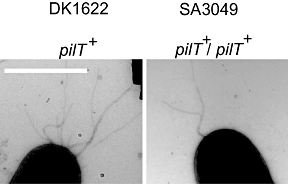
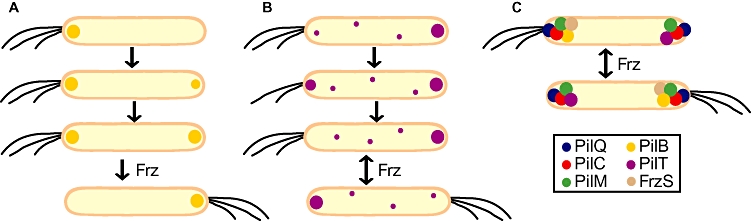
Type IV pili (T4P) are surface structures that undergo extension/retraction oscillations to generate cell motility. In Myxococcus xanthus, T4P are unipolarly localized and undergo pole-to-pole oscillations synchronously with cellular reversals. We investigated the mechanisms underlying these oscillations. We show that several T4P proteins localize symmetrically in clusters at both cell poles between reversals, and these clusters remain stationary during reversals. Conversely, the PilB and PilT motor ATPases that energize extension and retraction, respectively, localize to opposite poles with PilB predominantly at the piliated and PilT predominantly at the non-piliated pole, and these proteins oscillate between the poles during reversals. Therefore, T4P pole-to-pole oscillations involve the disassembly of T4P machinery at one pole and reassembly of this machinery at the opposite pole. Fluorescence recovery after photobleaching experiments showed rapid turnover of YFP-PilT in the polar clusters between reversals. Moreover, PilT displays bursts of accumulation at the piliated pole between reversals. These observations suggest that the spatial separation of PilB and PilT in combination with the noisy PilT accumulation at the piliated pole allow the temporal separation of extension and retraction. This is the first demonstration that the function of a molecular machine depends on disassembly and reassembly of its individual parts.


Figures

Fig. 1
Fig. 1
PilQ localizes in a bipolar, symmetric pattern. A. Localization of PilQ by immunofluorescence microscopy. Cells were harvested from exponentially growing cultures, fixed, probed with anti-PilQ antibodies and secondary antibodies, and imaged by fluorescence and phase-contrast microscopy. Top and bottom rows show phase-contrast and fluorescence images respectively. Scale bar: 5 μm. B. Histogram of distribution of PilQ localization patterns. The integrated fluorescence intensities (arbitrary units) of the two background-subtracted polar clusters in a cell were measured and fold differences calculated. Fold differences from 1.0 to 2.0 represent a bipolar, symmetric pattern, differences between 2.1 and 12.0 represent a bipolar, asymmetric pattern, and differences > 12.1 represent a unipolar pattern. C. Schematic of cell indicating the three regions for which fluorescence signals were quantified. Grey ovals indicate polar clusters.
Fig. 2
Fig. 2
PilC localizes in a bipolar, symmetric pattern. A. Localization of PilC by immunofluorescence microscopy. Cells were harvested from exponentially growing cultures and analysed as described in Fig. 1A using anti-PilC antibodies. Top and bottom rows show phase-contrast and fluorescence images respectively. Scale bar: 5 μm. B. Histogram of distribution of PilC localization patterns. Data are presented as in Fig. 1B.
Fig. 3
Fig. 3
PilM localizes in a bipolar, symmetric pattern. A. Localization of YFP–PilM. Cells were transferred from exponentially growing cultures to a thin 0.7% agar pad on a microscope slide, and imaged by fluorescence and phase-contrast microscopy. Top and bottom rows show phase-contrast and fluorescence images respectively. Scale bar: 5 μm. B. Localization of PilM by immunofluorescence microscopy. Cells were harvested from exponentially growing cultures and analysed as described in Fig. 1A using anti-PilM antibodies. Top and bottom rows show phase-contrast and fluorescence images respectively. C. Histogram of distribution of PilM localization patterns. The data for DK1622 are from immunofluorescence microscopy and for SA3046 from YFP–PilM localization. Data are presented as in Fig. 1B. D. YFP–PilM localization in moving cells. Cells of SA3046 and SA3059 were grown exponentially in CTT, transferred to a thin 0.7% agar pad on a microscope slide, and imaged by fluorescence microscopy at 30 s intervals. Representative cells are shown. The SA3046 cell stopped and reversed from 2:30 to 3:30. Arrows indicate the direction of movement. Scale bar: 5 μm. E. Quantitative analysis of polar YFP–PilM fluorescence signals. Integrated fluorescence intensities (arbitrary units) of the two background-subtracted polar clusters in the cells in (D) plotted as a function of time.
Fig. 4
Fig. 4
PilB localizes in three polar patterns. A. Localization of PilB by immunofluorescence microscopy. Cells were harvested from exponentially growing cultures and samples were analysed as in Fig. 1A using anti-PilB antibodies. Top and bottom rows show phase-contrast and fluorescence images respectively. Scale bar: 5 μm. B. Histogram of distribution of PilB localization patterns. Data are presented as in Fig. 1B. C. The large PilB cluster localizes opposite to RomR–GFP. Cells were grown, fixed and visualized as in (A).
Fig. 5
Fig. 5
PilT localization is dynamic. A. Localization of YFP–PilT. Cells were transferred from exponentially growing cultures to a thin 1.0% agar pad on a microscope slide, and imaged by fluorescence and phase-contrast microscopy. Top and bottom rows show phase-contrast and fluorescence images respectively. Scale bar: 5 μm. B. Localization of PilT by immunofluorescence microscopy. Cells were harvested from exponentially growing suspension cultures and samples analysed as in Fig. 1A using anti-PilT antibodies. Top and bottom rows show phase-contrast and fluorescence images respectively. C. Histogram of distribution of PilT localization patterns. The data for DK1622 are from immunofluorescence microscopy and for SA3045 from YFP–PilT localization. Data are presented as in Fig. 1B. D. The large PilT cluster colocalizes with the large RomR–GFP cluster. Cells were grown, fixed and visualized as in (B). E. YFP–PilT localization in moving cells. Cells of SA3045, SA3029 and SA3064 were grown exponentially in CTT, transferred to a thin 0.7% agar pad on a microscope slide, and imaged by fluorescence microscopy at 30 s intervals. Representative cells are shown. The SA3045 cell in panel II reversed from 1:30 to 2:30 and the SA3064 cell reversed from 3:30 to 4:00. White arrows indicate the direction of movement. Scale bar: 3 μm. F. Quantitative analysis of polar YFP–PilT fluorescence signals. Integrated fluorescence intensities (arbitrary units) of the two background-subtracted polar clusters in the cells in (E) were plotted as a function of time.
Fig. 6
Fig. 6
PilT localization is independent of PilB and dependent on ATPase activity. A. Cells of SA3043 and SA3026 were grown exponentially in CTT, transferred to a thin 0.7% agar pad on a microscope slide, and imaged by fluorescence microscopy at 30 s intervals. Representative cells are shown. The SA3043 cell reversed from 3:00 to 3:30. White arrows indicate the direction of movement. Scale bar: 3 μm. B. Quantitative analysis of polar YFP–PilT fluorescence signals. Integrated fluorescence intensities (arbitrary units) of the two background-subtracted polar clusters in the SA3043 cell in (A) plotted as a function of time.
Fig. 7
Fig. 7
Polar PilT clusters are in a dynamic equilibrium. A. Successive fluorescence images of YFP–PilT cells (SA3045) before (0 s) and after bleaching (3 s to 120 s) of a polar region. Bleaching was for 1 s. Bleached polar regions are indicated by arrows. In the cell on the left, the polar region with the large YFP–PilT cluster was bleached, and in the cell on the right, the polar region with the small YFP–PilT cluster was bleached. B and C. Quantitative analysis of recovery and loss of YFP–PilT fluorescence signals. Integrated fluorescence intensities (arbitrary units) of the polar clusters, the total polar signal (sum of the two polar cluster signals) and the total cytoplasmic signal in the cells in (A) were plotted as a function of time. Data in (B) and (C) are from the cell in the left and right panels in (A) respectively.
Fig. 8
Fig. 8
Overexpression of PilT reduces the number of T4P. Cells from exponentially growing cultures of the indicated strains were directly transferred to a grid, stained with 2% (w/v) uranyl acetate and visualized using transmission electron microscopy. Scale bar, 1.0 μm. Wild-type cells contain 6.5 ± 3.0 T4P per piliated pole and pilT+/pilT+ cells 3.4 ± 2.0 T4P per piliated pole (P = 0.0005).
Fig. 9
Fig. 9
T4P function depends on disassembly and reassembly processes. A. Model for PilB localization. Immediately after a reversal, PilB is unipolarly localized at the T4P pole. During a reversal period, PilB also builds up at the non-piliated pole giving rise to a bipolar, asymmetric and a bipolar, symmetric pattern. In response to Frz activity, PilB localization is reset to a unipolar pattern with PilB at the new leading pole. B. Model for PilT localization. The majority of PilT is localized to a large cluster at the lagging cell pole with some PilT in the cytoplasm. PilT is rapidly turned over in the cluster resulting in the stochastic accumulation of PilT at the leading cell pole followed by retraction of T4P. In the absence of PilT at the leading cell pole, T4P extension is catalysed by PilB. In response to Frz activity, the PilT cluster at the lagging cell pole relocalizes to the new lagging cell pole. C. Pole switching of T4P involves the disassembly and reassembly of the T4P molecular machine. PilQ, PilC and PilM are present in symmetric clusters that remain stationary at the poles during cell reversals. PilB and FrzS are predominantly at the leading pole, PilT predominantly at the lagging pole, and these three proteins relocalize during a reversal in response to Frz activity.

Similar articles

Cited by

References

    1. Balasingham SV, Collins RF, Assalkhou R, Homberset H, Frye SA, Derrick JP, Tonjum T. Interactions between the lipoprotein PilP and the secretin PilQ in Neisseria meningitidis. J Bacteriol. 2007;189:5716–5727. - PMC - PubMed
    1. Bendtsen JD, Nielsen H, von Heijne G, Brunak S. Improved prediction of signal peptides: SignalP 3.0. J Mol Biol. 2004;16:783–795. - PubMed
    1. Blackhart BD, Zusman DR. ‘Frizzy’ genes of Myxococcus xanthus are involved in control of frequency of reversal of gliding motility. Proc Natl Acad Sci USA. 1985;82:8771–8774. - PMC - PubMed
    1. Blank TE, Donnenberg MS. Novel topology of BfpE, a cytoplasmic membrane protein required for type IV fimbrial biogenesis in enteropathogenic Escherichia coli. J Bacteriol. 2001;183:4435–4450. - PMC - PubMed
    1. Carbonnelle E, Helaine S, Nassif X, Pelicic V. A systematic genetic analysis in Neisseria meningitidis defines the Pil proteins required for assembly, functionality, stabilization and export of type IV pili. Mol Microbiol. 2006;61:1510–1522. - PubMed

Publication types

MeSH terms