

Infarct evolution in man studied in patients with first-time coronary occlusion in comparison to different species - implications for assessment of myocardial salvage
- PMID: 19775428
- PMCID: PMC2758877
- DOI: 10.1186/1532-429X-11-38
Infarct evolution in man studied in patients with first-time coronary occlusion in comparison to different species - implications for assessment of myocardial salvage
Abstract
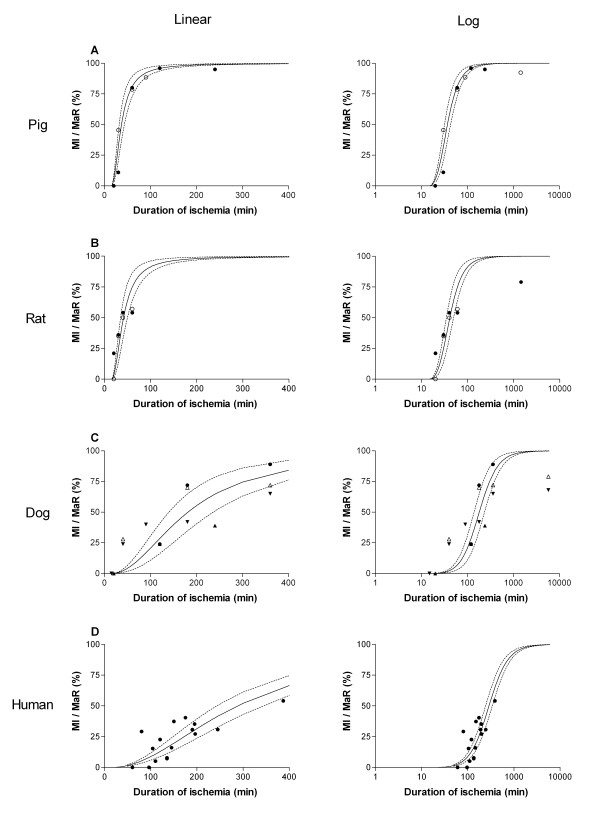
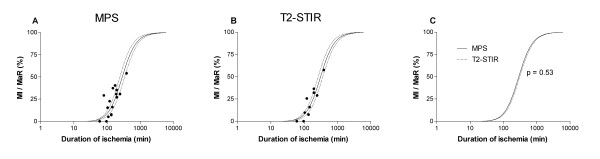
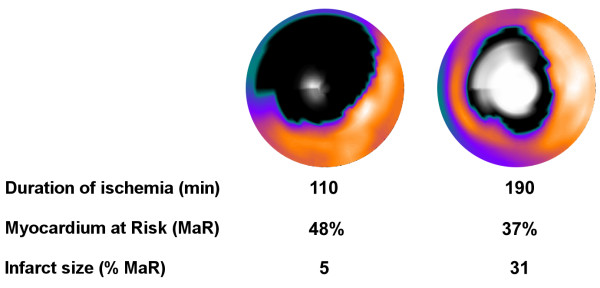
Background: The time course of infarct evolution, i.e. how fast myocardial infarction (MI) develops during coronary artery occlusion, is well known for several species, whereas no direct evidence exists on the evolution of MI size normalized to myocardium at risk (MaR) in man. Despite the lack of direct evidence, current literature often refers to the "golden hour" as the time during which myocardial salvage can be accomplished by reperfusion therapy. Therefore, the aim of the present study was to investigate how duration of myocardial ischemia affects infarct evolution in man in relation to previous animal data. Consecutive patients with clinical signs of acute myocardial ischemia were screened and considered for enrollment. Particular care was taken to assure uniformity of the patients enrolled with regard to old MI, success of revascularization, collateral flow, release of biochemical markers prior to intervention etc. Sixteen patients were ultimately included in the study. Myocardium at risk was assessed acutely by acute myocardial perfusion single photon emission computed tomography (MPS) and by T2 imaging (T2-STIR) cardiovascular magnetic resonance (CMR) after one week in 10 of the 16 patients. Infarct size was measured by late gadolinium enhancement (LGE) at one week.
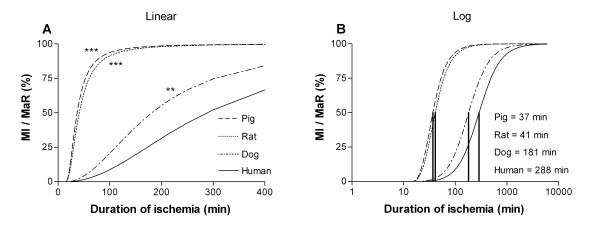
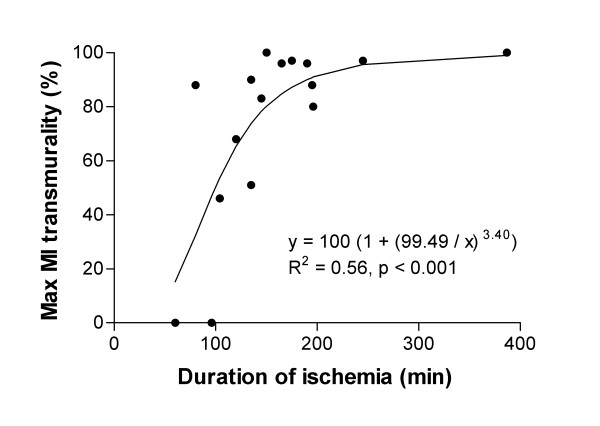
Results: The time to reach 50% MI of the MaR (T50) was significantly shorter in pigs (37 min), rats (41 min) and dogs (181 min) compared to humans (288 min). There was no significant difference in T50 when using MPS compared to T2-STIR (p = 0.53) for assessment of MaR (288 +/- 23 min vs 310 +/- 22 min, T50 +/- standard error). The transmural extent of MI increased progressively as the duration of ischemia increased (R2 = 0.56, p < 0.001).
Conclusion: This is the first study to provide direct evidence of the time course of acute myocardial infarct evolution in relation to MaR in man with first-time MI. Infarct evolution in man is significantly slower than in pigs, rats and dogs. Furthermore, infarct evolution assessments in man are similar when using MPS acutely and T2-STIR one week later for determination of MaR, which significantly facilitates future clinical trials of cardioprotective therapies in acute coronary syndrome by the use of CMR.
Figures
Similar articles
-
Assessment of myocardium at risk with contrast enhanced steady-state free precession cine cardiovascular magnetic resonance compared to single-photon emission computed tomography.J Cardiovasc Magn Reson. 2010 Apr 30;12(1):25. doi: 10.1186/1532-429X-12-25. J Cardiovasc Magn Reson. 2010. PMID: 20433716 Free PMC article.
-
Extent of Myocardium at Risk for Left Anterior Descending Artery, Right Coronary Artery, and Left Circumflex Artery Occlusion Depicted by Contrast-Enhanced Steady State Free Precession and T2-Weighted Short Tau Inversion Recovery Magnetic Resonance Imaging.Circ Cardiovasc Imaging. 2016 Jul;9(7):e004376. doi: 10.1161/CIRCIMAGING.115.004376. Circ Cardiovasc Imaging. 2016. PMID: 27412659 Clinical Trial.
-
Cardiovascular magnetic resonance of the myocardium at risk in acute reperfused myocardial infarction: comparison of T2-weighted imaging versus the circumferential endocardial extent of late gadolinium enhancement with transmural projection.J Cardiovasc Magn Reson. 2010 Mar 29;12(1):18. doi: 10.1186/1532-429X-12-18. J Cardiovasc Magn Reson. 2010. PMID: 20350309 Free PMC article.
-
Quantification of myocardial salvage by myocardial perfusion SPECT and cardiac magnetic resonance--reference standards for ECG development.J Electrocardiol. 2014 Jul-Aug;47(4):525-34. doi: 10.1016/j.jelectrocard.2014.04.001. Epub 2014 Apr 13. J Electrocardiol. 2014. PMID: 24866753 Review.
-
Diagnostic and prognostic value of cardiac magnetic resonance imaging in assessing myocardial viability.Top Magn Reson Imaging. 2008 Feb;19(1):15-24. doi: 10.1097/RMR.0B013e31817d550c. Top Magn Reson Imaging. 2008. PMID: 18690157 Review.
Cited by
-
Design and validation of Segment--freely available software for cardiovascular image analysis.BMC Med Imaging. 2010 Jan 11;10:1. doi: 10.1186/1471-2342-10-1. BMC Med Imaging. 2010. PMID: 20064248 Free PMC article.
-
Review of journal of cardiovascular magnetic resonance 2010.J Cardiovasc Magn Reson. 2011 Sep 13;13(1):48. doi: 10.1186/1532-429X-13-48. J Cardiovasc Magn Reson. 2011. PMID: 21914185 Free PMC article. Review.
-
Delayed Reperfusion-Coronary Artery Reperfusion Close to Complete Myocardial Necrosis Benefits Remote Myocardium and Is Enhanced by Exercise.Front Physiol. 2019 Mar 7;10:157. doi: 10.3389/fphys.2019.00157. eCollection 2019. Front Physiol. 2019. PMID: 30899225 Free PMC article.
-
Multi-vendor, multicentre comparison of contrast-enhanced SSFP and T2-STIR CMR for determining myocardium at risk in ST-elevation myocardial infarction.Eur Heart J Cardiovasc Imaging. 2016 Jul;17(7):744-53. doi: 10.1093/ehjci/jew027. Epub 2016 Mar 21. Eur Heart J Cardiovasc Imaging. 2016. PMID: 27002140 Free PMC article.
-
Cardiovascular magnetic resonance imaging assessment of outcomes in acute myocardial infarction.World J Cardiol. 2017 Feb 26;9(2):109-133. doi: 10.4330/wjc.v9.i2.109. World J Cardiol. 2017. PMID: 28289525 Free PMC article. Review.
References
-
- Sobel BE, Bresnahan GF, Shell WE, Yoder RD. Estimation of infarct size in man and its relation to prognosis. Circulation. 1972;46(4):640–8. - PubMed
-
- Reimer KA, Jennings RB. The "wavefront phenomenon" of myocardial ischemic cell death. II. Transmural progression of necrosis within the framework of ischemic bed size (myocardium at risk) and collateral flow. Lab Invest. 1979;40(6):633–44. - PubMed
-
- Simes RJ, Topol EJ, Holmes DR, Jr, White HD, Rutsch WR, Vahanian A, Simoons ML, Morris D, Betriu A, Califf RM, et al. Link between the angiographic substudy and mortality outcomes in a large randomized trial of myocardial reperfusion. Importance of early and complete infarct artery reperfusion. GUSTO-I Investigators. Circulation. 1995;91(7):1923–8. - PubMed
Publication types
MeSH terms
LinkOut - more resources
Full Text Sources
Medical
