

Effects of sleep deprivation on sleep homeostasis and restoration during methadone-maintenance: a [31]P MRS brain imaging study
- PMID: 19775835
- PMCID: PMC2890252
- DOI: 10.1016/j.drugalcdep.2009.07.022
Effects of sleep deprivation on sleep homeostasis and restoration during methadone-maintenance: a [31]P MRS brain imaging study
Abstract
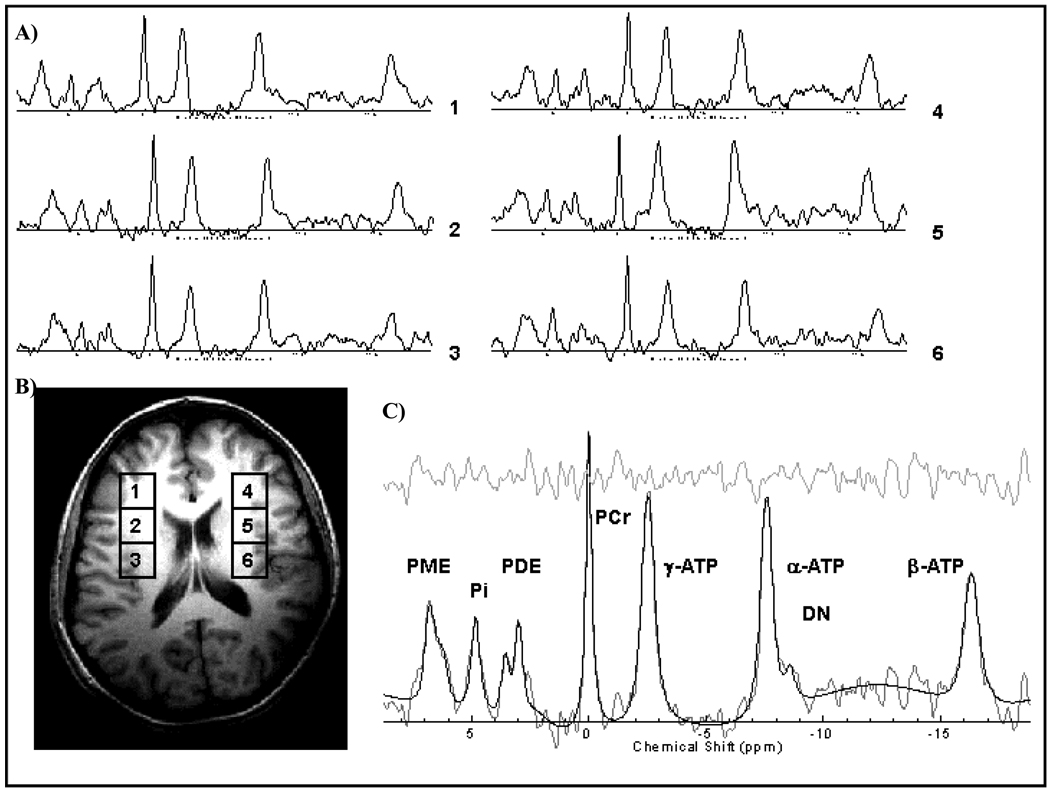
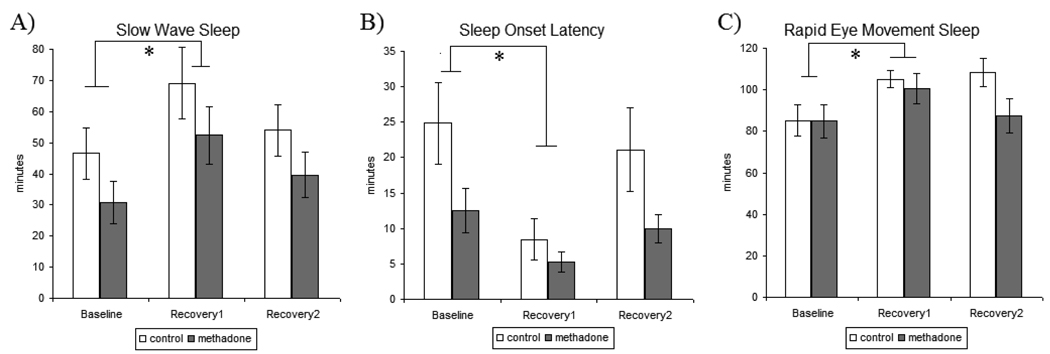
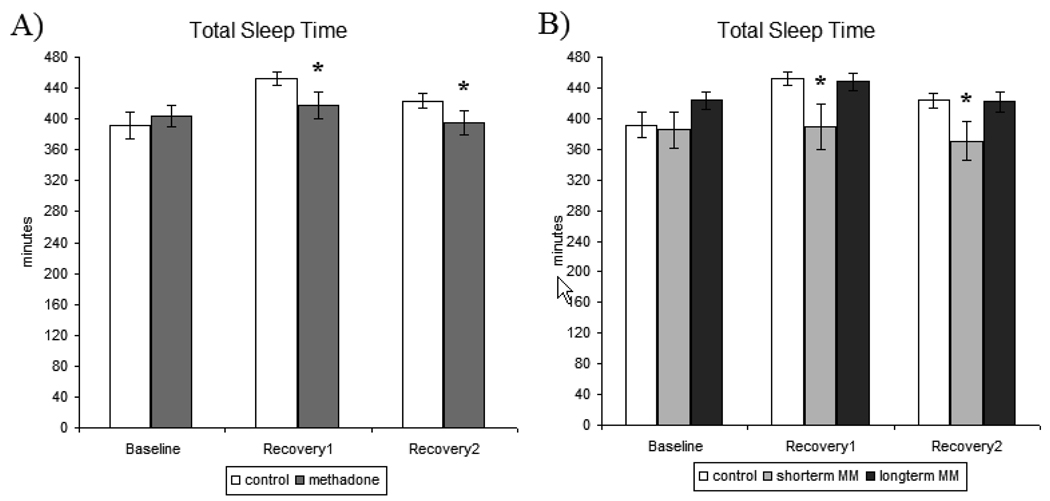
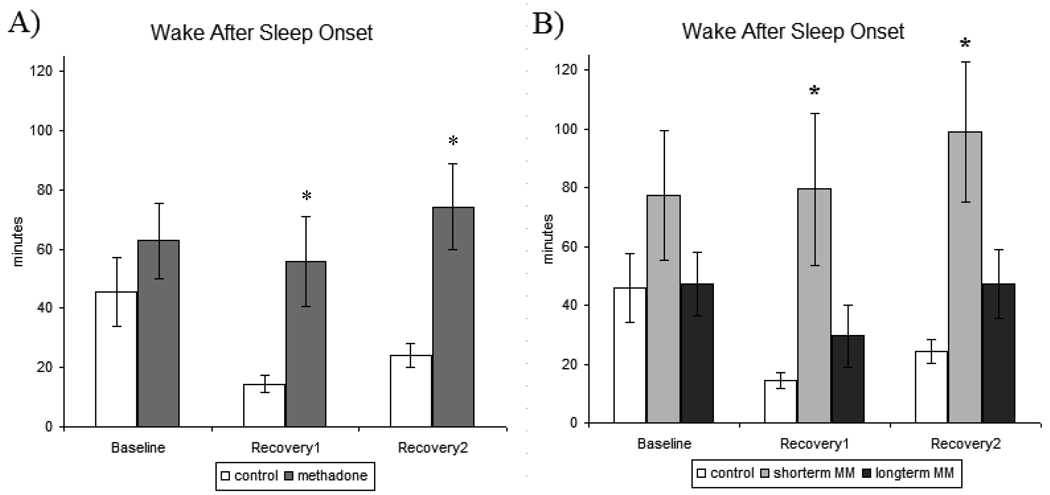
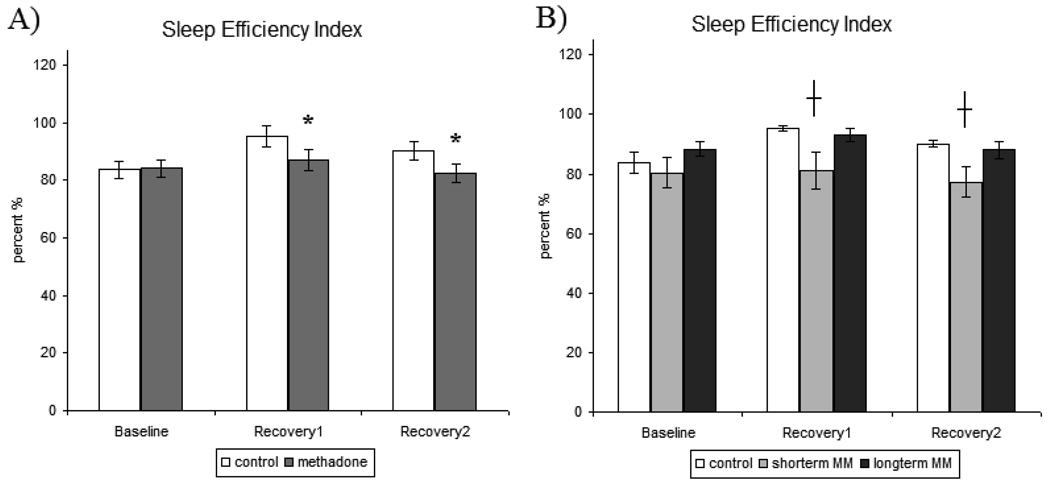
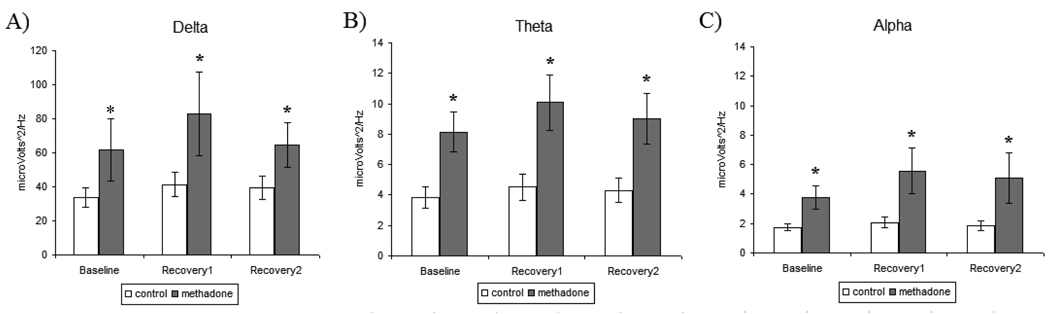
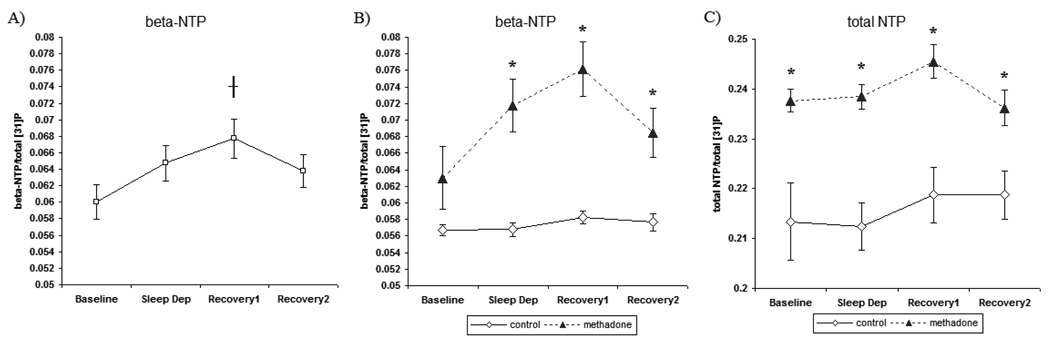
Insomnia afflicts many individuals, but particularly those in chronic methadone treatment. Studies examining sleep deprivation (SD) have begun to identify sleep restoration processes involving brain bioenergetics. The technique ([31])P magnetic resonance spectroscopy (MRS) can measure brain changes in the high-energy phosphates: alpha-, beta-, and gamma-nucleoside triphosphate (NTP). In the present study, 21 methadone-maintained (MM) and 16 control participants underwent baseline (BL), SD (40 wakeful hours), recovery1 (RE1), and recovery2 (RE2) study nights. Polysomnographic sleep was recorded each night and ([31])P MRS brain scanning conducted each morning using a 4T MR scanner (dual-tuned proton/phosphorus head-coil). Interestingly, increases in total sleep time (TST) and sleep efficiency index (SEI) commonly associated with RE sleep were not apparent in MM participants. Analysis of methadone treatment duration revealed that the lack of RE sleep increases in TST and SEI was primarily exhibited by short-term MM participants (methadone <12 months), while RE sleep in long-term MM (methadone >12 months) participants was more comparable to control participants. Slow wave sleep increased during RE1, but there was no difference between MM and control participants. Spectral power analysis revealed that compared to control participants; MM participants had greater delta, theta, and alpha spectral power during BL and RE sleep. ([31])P MRS revealed that elevations in brain beta-NTP (a direct measure of ATP) following RE sleep were greater in MM compared to control participants. Results suggest that differences in sleep and brain chemistry during RE in MM participants may be reflective of a disruption in homeostatic sleep function.
Copyright (c) 2009 Elsevier Ireland Ltd. All rights reserved.
Figures
Similar articles
-
Gray matter-specific changes in brain bioenergetics after acute sleep deprivation: a 31P magnetic resonance spectroscopy study at 4 Tesla.Sleep. 2014 Dec 1;37(12):1919-27. doi: 10.5665/sleep.4242. Sleep. 2014. PMID: 25325507 Free PMC article.
-
Brain phosphorus magnetic resonance spectroscopy imaging of sleep homeostasis and restoration in drug dependence.ScientificWorldJournal. 2007 Nov 2;7:217-22. doi: 10.1100/tsw.2007.233. ScientificWorldJournal. 2007. PMID: 17982596 Free PMC article. Review.
-
Response inhibition and psychomotor speed during methadone maintenance: impact of treatment duration, dose, and sleep deprivation.Drug Alcohol Depend. 2012 Sep 1;125(1-2):132-9. doi: 10.1016/j.drugalcdep.2012.04.004. Epub 2012 Apr 30. Drug Alcohol Depend. 2012. PMID: 22552256 Free PMC article.
-
Phosphorous31 magnetic resonance spectroscopy after total sleep deprivation in healthy adult men.Sleep. 2003 Aug 1;26(5):573-7. doi: 10.1093/sleep/26.5.573. Sleep. 2003. PMID: 12938810
-
Sleep homeostasis in primary insomnia.Sleep Med Rev. 2006 Aug;10(4):247-54. doi: 10.1016/j.smrv.2005.09.002. Epub 2006 Mar 24. Sleep Med Rev. 2006. PMID: 16563817 Review.
Cited by
-
Crosstalk between Sleep Disturbance and Opioid Use Disorder: A Narrative Review.Addict Health. 2020 Apr;12(2):140-158. doi: 10.22122/ahj.v12i2.249. Addict Health. 2020. PMID: 32782736 Free PMC article. Review.
-
Sleep abnormalities associated with alcohol, cannabis, cocaine, and opiate use: a comprehensive review.Addict Sci Clin Pract. 2016 Apr 26;11(1):9. doi: 10.1186/s13722-016-0056-7. Addict Sci Clin Pract. 2016. PMID: 27117064 Free PMC article. Review.
-
Predictors of sleep disturbance in heroin users receiving methadone maintenance therapy: a naturalistic study in Taiwan.Neuropsychiatr Dis Treat. 2018 Oct 26;14:2853-2859. doi: 10.2147/NDT.S177370. eCollection 2018. Neuropsychiatr Dis Treat. 2018. PMID: 30464470 Free PMC article.
-
Let the vessels rest.Sleep. 2013 Oct 1;36(10):1415-6. doi: 10.5665/sleep.3022. Sleep. 2013. PMID: 24082298 Free PMC article. No abstract available.
-
The Utility of Magnetic Resonance Spectroscopy for Understanding Substance Use Disorders: A Systematic Review of the Literature.J Am Psychiatr Nurses Assoc. 2015 Jul-Aug;21(4):244-75. doi: 10.1177/1078390315598606. J Am Psychiatr Nurses Assoc. 2015. PMID: 26282670 Free PMC article.
References
-
- Arborelius L, Owens MJ, Plotsky PM, Nemeroff CB. The role of corticotrophin-releasing factor in depression and anxiety disorders. The Journal of endocrinology. 1999;160:1–12. - PubMed
-
- Armitage R, Hoffmann R, Fitch T, Morel C, Bonato R. A comparison of period amplitude and power spectral analysis of sleep EEG in normal adults and depressed outpatients. Psychiatry Res. 1995;56:245–256. - PubMed
-
- Athanasos P, Smith CS, White JM, Somogyi AA, Bochner F, Ling W. Methadone maintenance patients are cross-tolerant to the antinociceptive effects of very high plasma morphine concentrations. Pain. 2006;120:267–275. - PubMed
Publication types
MeSH terms
Substances
Grants and funding
LinkOut - more resources
Full Text Sources
