

Control of respiration by cytochrome c oxidase in intact cells: role of the membrane potential
- PMID: 19776013
- PMCID: PMC2781647
- DOI: 10.1074/jbc.M109.050146
Control of respiration by cytochrome c oxidase in intact cells: role of the membrane potential
Abstract
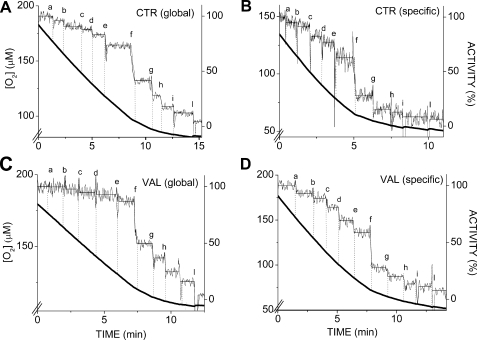
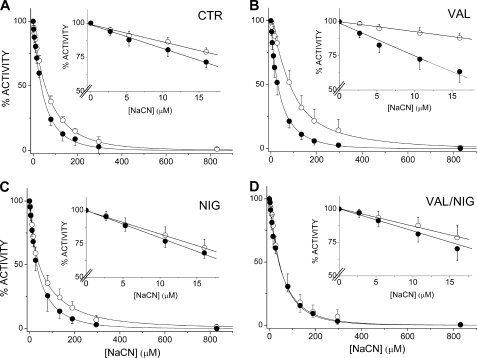
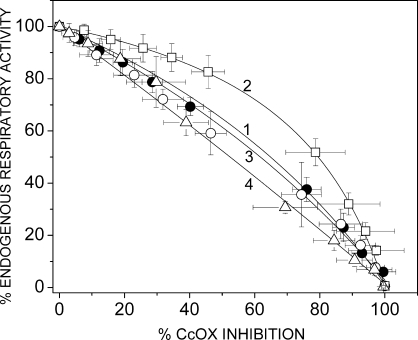
Metabolic control analysis was applied to intact HepG2 cells. The effect on the control coefficient of cytochrome c oxidase (CcOX) over cell respiration of both the electrical (Delta psi) and chemical (Delta pH) component of the mitochondrial transmembrane proton electrochemical gradient (Delta mu(H(+))) was investigated. The overall O(2) consumption and specific CcOX activity of actively phosphorylating cells were titrated with cyanide under conditions in which Delta psi and Delta pH were selectively modulated by addition of ionophores. In the absence of ionophores, CcOX displayed a high control coefficient (C(IV) = 0.73), thus representing an important site of regulation of mitochondrial oxidative phosphorylation. A high control coefficient value (C(IV) = 0.85) was also measured in the presence of nigericin, i.e. when Delta psi is maximal, and in the presence of nigericin and valinomycin (C(IV) = 0.77), when Delta mu(H(+)) is abolished. In contrast, CcOX displayed a markedly lower control coefficient (C(IV) = 0.30) upon addition of valinomycin, when Delta psi is converted into Delta pH. These results show that Delta psi is responsible for the tight control of CcOX over respiration in actively phosphorylating cells.
Figures
References
-
- Brunori M., Giuffrè A., Sarti P. (2005)J. Inorg. Biochem. 99,324–336 - PubMed
-
- Nicholls D. G., Ferguson S. J. (2002)Bioenergetics,3rd Ed.,Academic Press,London
-
- Chance B., Williams G. R. (1955)J. Biol. Chem. 217,409–427 - PubMed
-
- Kadenbach B., Ramzan R., Vogt S. (2009)Trends Mol. Med. 15,139–147 - PubMed
Publication types
MeSH terms
Substances
LinkOut - more resources
Full Text Sources
Research Materials
