Comparative Study
. 2009 Dec 15;18(24):4808-17.
doi: 10.1093/hmg/ddp445. Epub 2009 Sep 23.

Epigenetic profiling of somatic tissues from human autopsy specimens identifies tissue- and individual-specific DNA methylation patterns

Affiliations
Comparative Study

Epigenetic profiling of somatic tissues from human autopsy specimens identifies tissue- and individual-specific DNA methylation patterns

Hyang-Min Byun et al. Hum Mol Genet. .

Abstract

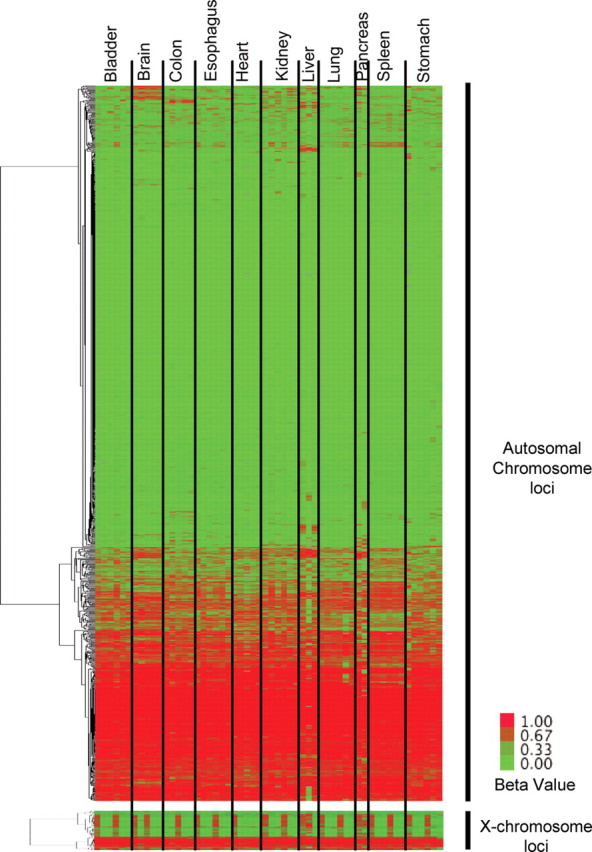
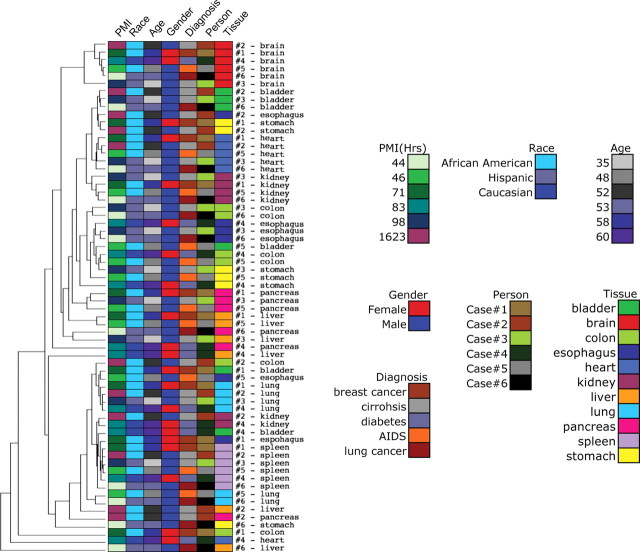
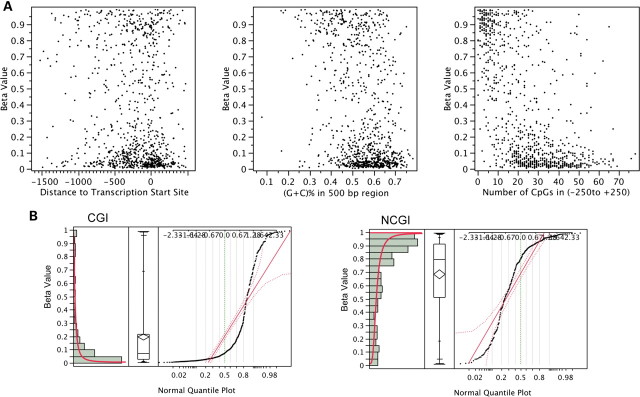
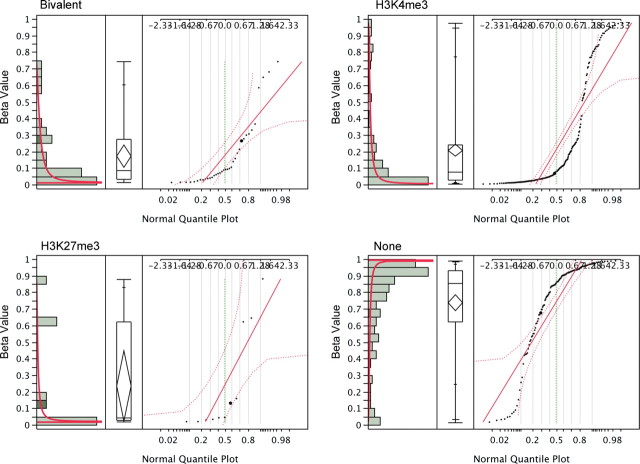
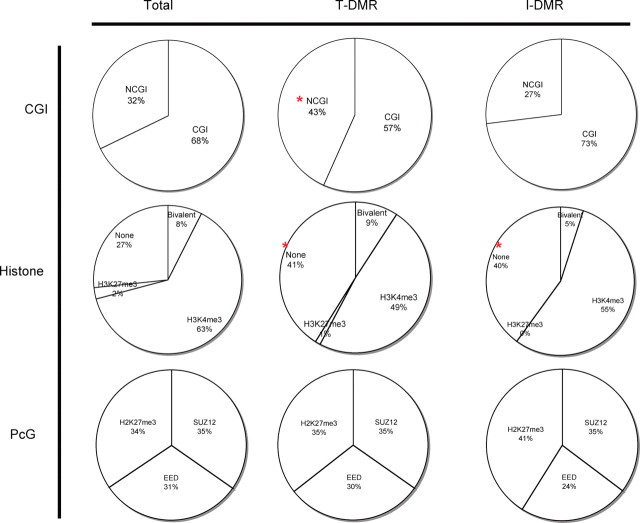
DNA methylation is known to be associated with cell differentiation, aging, disease and cancer. There exists an expanding base of knowledge regarding tissue-specific DNA methylation, but we have little information about person-specific DNA methylation. Here, we analyze the DNA methylation patterns of multiple tissues from multiple individuals using a high-throughput quantitative assay of genome-wide DNA methylation, namely the Illumina GoldenGate BeadArray. DNA methylation patterns were largely conserved across 11 different tissues (r = 0.852) and across six individuals (r = 0.829), and we found that DNA was highly methylated in non-CpG islands and/or CpG sites that are not occupied by either H3K4me3 or H3K27me3 (P < 0.05). Finally, we found that the Illumina GoldenGate assay features a large number of probes (265/1505 probes, 17.6%) that contain single-nucleotide polymorphisms, which may interfere with DNA methylation analyses in genome-wide studies.


Figures

Figure 1.
Figure 1.
High-throughput DNA methylation analysis of 11 different tissues from each of the six individuals. The Illumina GoldenGate BeadArray DNA methylation was used to analyze the DNA methylation of 1505 CpG sites (807 genes) for 11 different tissues from each of the six individuals who had undergone autopsy. DNA methylation data for 905 autosomal CpG sites were analyzed by one-dimensional hierarchical cluster (CpG sites: rows; tissue DNA samples: columns, organized by tissue). X-chromosome genes (n = 84) are analyzed separately and shown at the bottom. Green indicates low beta values, representing low DNA methylation levels, and red indicates high beta values, representing higher DNA methylation levels. Note that the data for only three liver and two pancreas sample tissues are shown since certain samples failed quality controls (see Materials and Methods).
Figure 2.
Figure 2.
Venn diagram showing the number of T-DMR and/or I-DMR loci. DNA methylation varies across tissues for 431 of the 905 CpG loci studied, and varies across individuals for 25 loci. Twenty targets vary across both tissue and person, and 429 CpG loci are randomly methylated across tissue and/or person (both BH corrected P > 0.05).
Figure 3.
Figure 3.
Validation of Illumina data using bisulfite-PCR Pyrosequencing. Illumina BeadArray DNA methylation analyses of macrophage stimulating 1 receptor (MST1R_p392_F) (A), a tissue-specific gene, and neurotrophic tyrosine kinase receptor type 1 (NTRK1_E74_F) (B), an individual-specific gene, were validated using a more quantitative DNA methylation analysis method, namely bisulfite-PCR Pyrosequencing. The y-axis represents either the beta value from Illumina analysis or the percentage of DNA methylation as evidenced by Pyrosequencing. The x-axis represents either tissue or autopsy case IDs. Data are represented as mean ± SEM.
Figure 4.
Figure 4.
Intra-tissue and intra-individual variability of DNA methylation. Two-way hierarchical cluster analysis consistent with DNA methylation profiles of 11 organs from six individuals. The color codes for tissue, person, diagnosis, gender, age, race and PMI are based on data in Table 1.
Figure 5.
Figure 5.
Distribution of mean CpG methylation. (A) The comparison of mean CpG methylation with distance to TSS (left), (G+C)% in 500 bp region (middle) and number of CpGs (right). DNA methylation levels are not correlated with distance to TSS (r = −0.035, P = 0.29) or GC% (r = −0.380, P < 0.05), but are correlated with number of CpGs (r = −0.6112, P < 1 × 10⁻¹⁶). (B) The DNA methylation level is highly correlated with NCGI (r = 0.6408, P < 1 × 10⁻¹⁶). The median methylation level in the CGI loci exhibits a beta value of 0.071, and the same value measures 0.797 in the case of NCGI. Also shown are histogram (left), quantile box plot (middle) and normal quantile plot with continuous fit, beta (right).
Figure 6.
Figure 6.
Correlation of CpG methylation with histone status. Median CpG methylation in an area with H3K4me3 and H3K27me3 histone markers (‘Bivalent’, n = 36) exhibits a beta value of 0.088; for ‘H3K4me3’, the value is 0.078 (n = 224). Equivalent metrics are 0.4 for ‘H3K27me3’ (n = 11) and 0.856 for areas that exhibit neither H3K4me3 nor H3K27me3 histone markers (‘None,’ n = 127). ‘Bivalent’ and ‘H3K4me3’ loci are unmethylated, and ‘None’ are highly methylated (P < 0.05). Also shown are the histogram (left), quantile box plot (middle) and normal quantile plot with continuous fit, beta (right).
Figure 7.
Figure 7.
Characteristics of tissue-specific genes (T-DMR) and individual-specific genes (I-DMR). The ‘Total’ column of the pie charts represents the subset of 905 loci that were analyzed by the Illumina platform and used in our analysis. The ‘T-DMR’ column of the charts includes the 521 tissue-specific genes, and the ‘I-DMR’ includes the 30 individual specific genes. The ‘CGI’ top row reflects the ratio of CGIs versus NCGIs. The ‘Histone’ middle row lists the distribution of H3K4 and H3K27 trimethylation histone marks on the basis of previous reports that focus on ES cells. Finally, the bottom row examines the association with the PcG complex (SUZ12, EED, H3K27me3). We note a trend whereby genes that show ‘T-DMR’-specific DNA methylation tend to be associated with NCGI promoters and are not associated with H3K4me3 or H3K27me3.

Similar articles

Cited by

References

    1. Bibikova M., Laurent L.C., Ren B., Loring J.F., Fan J.B. Unraveling epigenetic regulation in embryonic stem cells. Cell Stem Cell. 2008;2:123–134. - PubMed
    1. Hellman A., Chess A. Gene body-specific methylation on the active X-chromosome. Science (New York, N.Y.) 2007;315:1141–1143. - PubMed
    1. Feinberg A.P. Phenotypic plasticity and the epigenetics of human disease. Nature. 2007;447:433–440. - PubMed
    1. Richardson B.C. Role of DNA methylation in the regulation of cell function: autoimmunity, aging and cancer. J. Nutr. 2002;132:2401S–2405S. - PubMed
    1. Ahuja N., Li Q., Mohan A.L., Baylin S.B., Issa J.P. Aging and DNA methylation in colorectal mucosa and cancer. Cancer Res. 1998;58:5489–5494. - PubMed

Publication types