The reverse cholesterol transport system as a potential mediator of luteolysis in the primate corpus luteum
- PMID: 19776099
- PMCID: PMC3255460
- DOI: 10.1530/REP-09-0005
The reverse cholesterol transport system as a potential mediator of luteolysis in the primate corpus luteum
Abstract
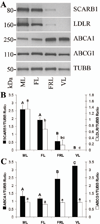
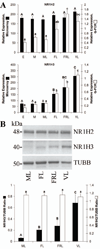
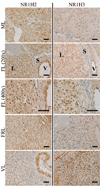
The cessation of progesterone (P(4)) production (i.e. functional regression), arguably the key event in luteolysis of the primate corpus luteum (CL), is poorly understood. Previously, we found that genes encoding proteins involved in cholesterol uptake decreased, while those involved in cholesterol efflux (reverse cholesterol transport, RCT) increased in expression during spontaneous functional regression of the rhesus macaque CL, thereby potentially depleting the cholesterol reserves needed for steroidogenesis. Therefore, a comprehensive analysis of the components necessary for RCT was performed. RCT components were expressed (mRNA and/or protein) in the macaque CL including cholesterol sensors (liver X receptors alpha or NR1H3; and beta or NR1H2), efflux proteins (ATP-binding cassette subfamilies A1 (ABCA1) and G1), acceptors (apolipoproteins A1 or APOA1; and E or APOE), and plasma proteins facilitating high-density lipoprotein formation (lecithin:cholesterol acyltransferase or LCAT; phospholipid transfer protein or PLTP). ABCA1, APOE, PLTP, and NR1H3 increased, while lipoprotein receptors decreased, in expression (mRNA and/or protein) through the period of functional regression. The expression of APOA1 and APOE, as well as NR1H3, was greatest in the CL and tissues involved in regulating cholesterol homeostasis. Immunolocalization studies revealed that RCT proteins and lipoprotein receptors were expressed in large luteal cells, which possess intracellular cholesterol reserves during periods of P(4) synthesis. Lipid staining revealed changes in luteal cholesterol ester/lipid distribution that occurred following functional regression. These results indicate that decreased cholesterol uptake and increased RCT may be critical for the initiation of primate luteolysis by limiting intracellular cholesterol pools required for steroidogenesis.
Conflict of interest statement
The authors declare that there is no conflict of interest that could be perceived as prejudicing the impartiality of the research reported.
Figures


Similar articles
-
Expressions of lipoprotein receptors and cholesterol efflux regulatory proteins during luteolysis in bovine corpus luteum.Reprod Fertil Dev. 2017 Jul;29(7):1280-1286. doi: 10.1071/RD15538. Reprod Fertil Dev. 2017. PMID: 27185011
-
Liver x receptor modulation of gene expression leading to proluteolytic effects in primate luteal cells.Biol Reprod. 2012 Mar 30;86(3):89. doi: 10.1095/biolreprod.111.096347. Print 2012 Mar. Biol Reprod. 2012. PMID: 22156476 Free PMC article.
-
Expression patterns of genes in steroidogenic, cholesterol uptake, and liver x receptor-mediated cholesterol efflux pathway regulating cholesterol homeostasis in natural and PGF2α induced luteolysis as well as early pregnancy in ovine corpus luteum.Anim Reprod Sci. 2022 May;240:106988. doi: 10.1016/j.anireprosci.2022.106988. Epub 2022 May 5. Anim Reprod Sci. 2022. PMID: 35533584
-
Analysis of microarray data from the macaque corpus luteum; the search for common themes in primate luteal regression.Mol Hum Reprod. 2011 Mar;17(3):143-51. doi: 10.1093/molehr/gaq080. Epub 2010 Sep 20. Mol Hum Reprod. 2011. PMID: 20855453 Free PMC article. Review.
-
Reverse cholesterol transport and cholesterol efflux in atherosclerosis.QJM. 2005 Dec;98(12):845-56. doi: 10.1093/qjmed/hci136. Epub 2005 Oct 28. QJM. 2005. PMID: 16258026 Review.
Cited by
-
The liver X receptors and sterol regulatory element binding proteins alter progesterone secretion and are regulated by human chorionic gonadotropin in human luteinized granulosa cells.Mol Cell Endocrinol. 2018 Sep 15;473:124-135. doi: 10.1016/j.mce.2018.01.011. Epub 2018 Jan 31. Mol Cell Endocrinol. 2018. PMID: 29366778 Free PMC article.
-
Microarray analysis of the primate luteal transcriptome during chorionic gonadotrophin administration simulating early pregnancy.Mol Hum Reprod. 2012 Apr;18(4):216-27. doi: 10.1093/molehr/gar073. Epub 2011 Nov 9. Mol Hum Reprod. 2012. PMID: 22072816 Free PMC article.
-
Early transcriptome responses of the bovine midcycle corpus luteum to prostaglandin F2α includes cytokine signaling.Mol Cell Endocrinol. 2017 Sep 5;452:93-109. doi: 10.1016/j.mce.2017.05.018. Epub 2017 May 23. Mol Cell Endocrinol. 2017. PMID: 28549990 Free PMC article.
-
Exposure to environmentally relevant concentrations of ambient fine particulate matter (PM2.5) depletes the ovarian follicle reserve and causes sex-dependent cardiovascular changes in apolipoprotein E null mice.Part Fibre Toxicol. 2022 Jan 7;19(1):5. doi: 10.1186/s12989-021-00445-8. Part Fibre Toxicol. 2022. PMID: 34996492 Free PMC article.
-
Anti-tumorigenic and Platinum-Sensitizing Effects of Apolipoprotein A1 and Apolipoprotein A1 Mimetic Peptides in Ovarian Cancer.Front Pharmacol. 2019 Jan 28;9:1524. doi: 10.3389/fphar.2018.01524. eCollection 2018. Front Pharmacol. 2019. PMID: 30745873 Free PMC article.
References
-
- Brannian JD, Stouffer RL. Progesterone production by monkey luteal cell subpopulations at different stages of the menstrual cycle: changes in agonist responsiveness. Biology of Reproduction. 1991;44:141–149. - PubMed
-
- Cameron JL, Stouffer RL. Gonadotropin receptors of the primate corpus luteum. II. Changes in available luteinizing hormone- and chorionic gonadotropin-binding sites in macaque luteal membranes during the nonfertile menstrual cycle. Endocrinology. 1982;110:2068–2073. - PubMed
Publication types
MeSH terms
Substances
Grants and funding
LinkOut - more resources
Full Text Sources
Other Literature Sources
Medical
Molecular Biology Databases
Research Materials
Miscellaneous

