

Attenuation of age-related metabolic dysfunction in mice with a targeted disruption of the Cbeta subunit of protein kinase A
- PMID: 19776218
- PMCID: PMC2773816
- DOI: 10.1093/gerona/glp133
Attenuation of age-related metabolic dysfunction in mice with a targeted disruption of the Cbeta subunit of protein kinase A
Abstract
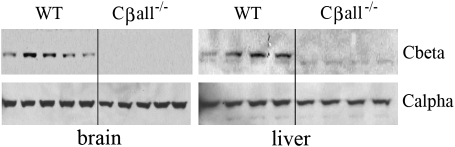
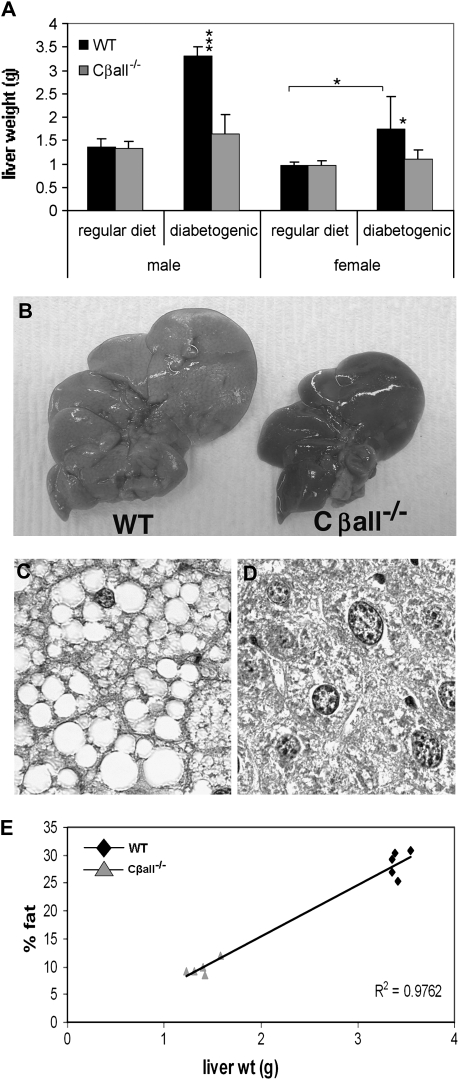
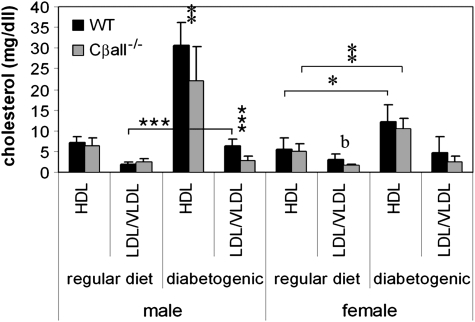
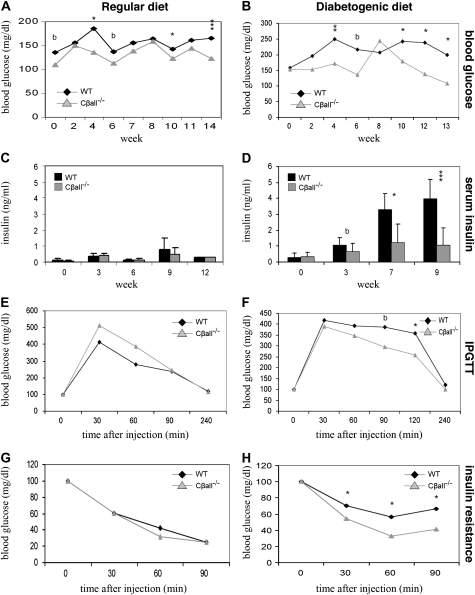
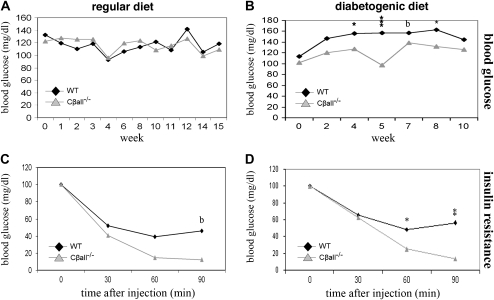
The cyclic adenosine monophosphate-dependent protein kinase A (PKA) pathway helps regulate both cell growth and division, and triglyceride storage and metabolism in response to nutrient status. Studies in yeast show that disruption of this pathway promotes longevity in a manner similar to caloric restriction. Because PKA is highly conserved, it can be studied in mammalian systems. This report describes the metabolic phenotype of mice lacking the PKA catalytic subunit Cbeta. We confirmed that Cbeta has high levels of expression in the brain but also showed moderate levels in liver. Cbeta-null animals had reduced basal PKA activity while appearing overtly normal when fed standard rodent chow. However, the absence of Cbeta protected mice from diet-induced obesity, steatosis, dyslipoproteinemia, and insulin resistance, without any differences in caloric intake or locomotor activity. These findings have relevant pharmacological implications because aging in mammals is characterized by metabolic decline associated with obesity, altered body fat distribution, and insulin resistance.
Figures

Similar articles
-
Loss of protein kinase Cbeta function protects mice against diet-induced obesity and development of hepatic steatosis and insulin resistance.Hepatology. 2009 May;49(5):1525-36. doi: 10.1002/hep.22815. Hepatology. 2009. PMID: 19296465 Free PMC article.
-
Differentially regulated protein kinase A (PKA) activity in adipose tissue and liver is associated with resistance to diet-induced obesity and glucose intolerance in mice that lack PKA regulatory subunit type IIα.Endocrinology. 2014 Sep;155(9):3397-408. doi: 10.1210/en.2014-1122. Epub 2014 Jun 10. Endocrinology. 2014. PMID: 24914943 Free PMC article.
-
PKA Cβ: a forgotten catalytic subunit of cAMP-dependent protein kinase opens new windows for PKA signaling and disease pathologies.Biochem J. 2021 Jun 11;478(11):2101-2119. doi: 10.1042/BCJ20200867. Biochem J. 2021. PMID: 34115095 Review.
-
Meprin-β activity modulates the β-catalytic subunit of protein kinase A in ischemia-reperfusion-induced acute kidney injury.Am J Physiol Renal Physiol. 2020 May 1;318(5):F1147-F1159. doi: 10.1152/ajprenal.00571.2019. Epub 2020 Mar 16. Am J Physiol Renal Physiol. 2020. PMID: 32174142 Free PMC article.
-
Hypothalamic inflammation in obesity and metabolic disease.J Clin Invest. 2017 Jan 3;127(1):24-32. doi: 10.1172/JCI88878. Epub 2017 Jan 3. J Clin Invest. 2017. PMID: 28045396 Free PMC article. Review.
Cited by
-
Mechanisms underlying the anti-aging and anti-tumor effects of lithocholic bile acid.Int J Mol Sci. 2014 Sep 18;15(9):16522-43. doi: 10.3390/ijms150916522. Int J Mol Sci. 2014. PMID: 25238416 Free PMC article. Review.
-
Unbalanced Growth, Senescence and Aging.Adv Exp Med Biol. 2017;1002:189-208. doi: 10.1007/978-3-319-57127-0_8. Adv Exp Med Biol. 2017. PMID: 28600787 Free PMC article. Review.
-
β2-Adrenergic receptor agonist induced hepatic steatosis in mice: modeling nonalcoholic fatty liver disease in hyperadrenergic states.Am J Physiol Endocrinol Metab. 2021 Jul 1;321(1):E90-E104. doi: 10.1152/ajpendo.00651.2020. Epub 2021 May 24. Am J Physiol Endocrinol Metab. 2021. PMID: 34029162 Free PMC article.
-
Linking Peroxiredoxin and Vacuolar-ATPase Functions in Calorie Restriction-Mediated Life Span Extension.Int J Cell Biol. 2014;2014:913071. doi: 10.1155/2014/913071. Epub 2014 Feb 3. Int J Cell Biol. 2014. PMID: 24639875 Free PMC article. Review.
-
The quality control theory of aging.Pathobiol Aging Age Relat Dis. 2014 May 23;4. doi: 10.3402/pba.v4.24835. eCollection 2014. Pathobiol Aging Age Relat Dis. 2014. PMID: 24891937 Free PMC article.
References
-
- Fontaine KR, Redden DT, Wang C, Westfall AO, Allison DB. Years of life lost due to obesity. JAMA. 2003;289:187–193. - PubMed
-
- Fabrizio P, Pozza F, Pletcher SD, Gendron CM, Longo VD. Regulation of longevity and stress resistance by Sch9 in yeast. Science. 2001;292:288–290. - PubMed
-
- Lin SJ, Defossez PA, Guarente L. Requirement of NAD and SIR2 for life-span extension by calorie restriction in Saccharomyces cerevisiae. Science. 2000;289:2126–2128. - PubMed
-
- Martin DE, Soulard A, Hall MN. TOR regulates ribosomal protein gene expression via PKA and the Forkhead transcription factor FHL1. Cell. 2004;119:969–979. - PubMed
Publication types
MeSH terms
Substances
Grants and funding
LinkOut - more resources
Full Text Sources
Medical
