. 2009 Sep 23;29(38):11828-40.
doi: 10.1523/JNEUROSCI.1259-09.2009.

Discharge profiles of identified GABAergic in comparison to cholinergic and putative glutamatergic basal forebrain neurons across the sleep-wake cycle

Affiliations

Discharge profiles of identified GABAergic in comparison to cholinergic and putative glutamatergic basal forebrain neurons across the sleep-wake cycle

Oum Kaltoum Hassani et al. J Neurosci. .

Abstract

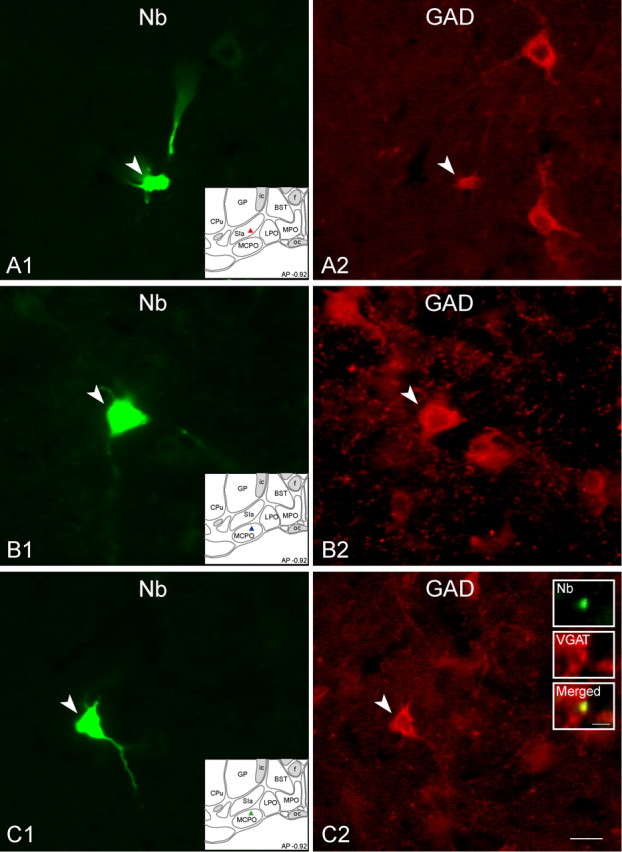
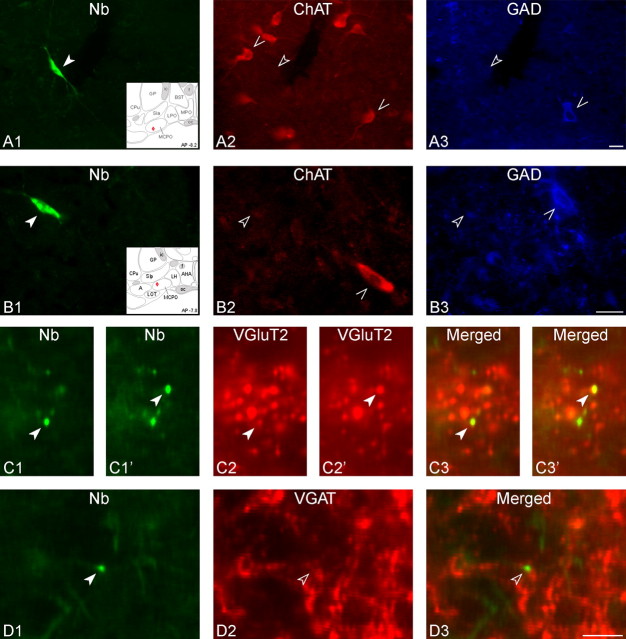
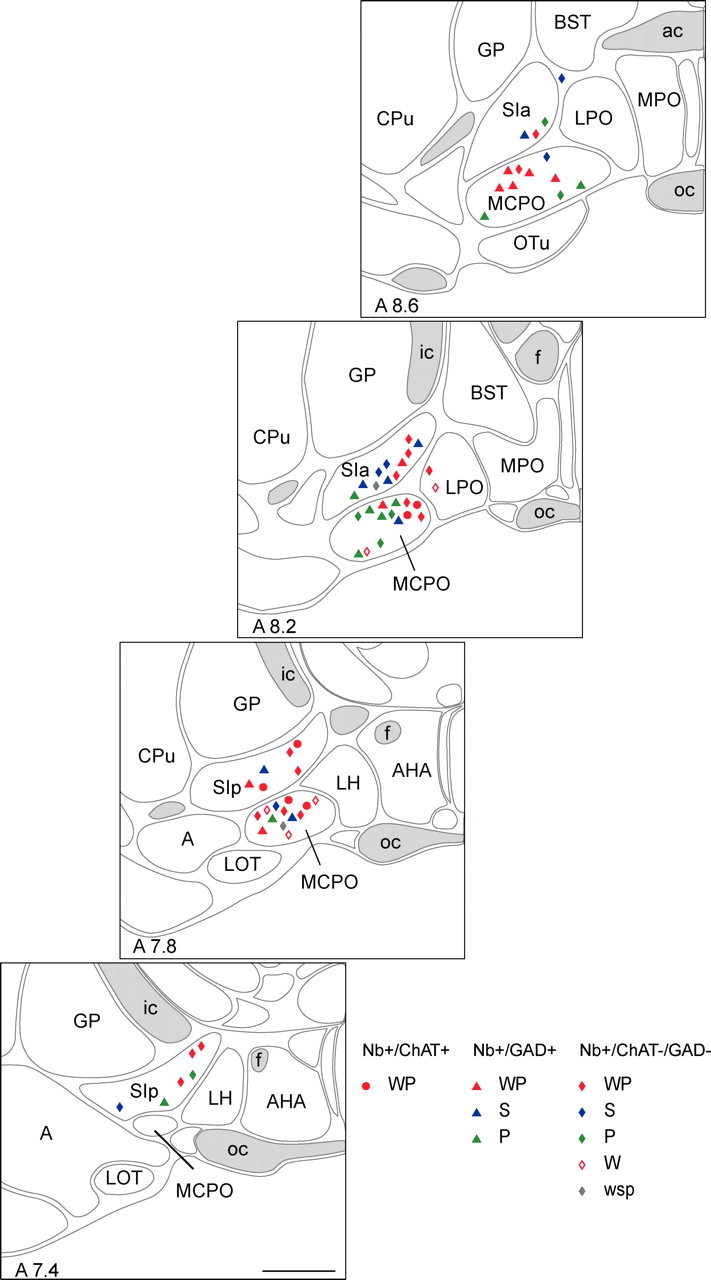
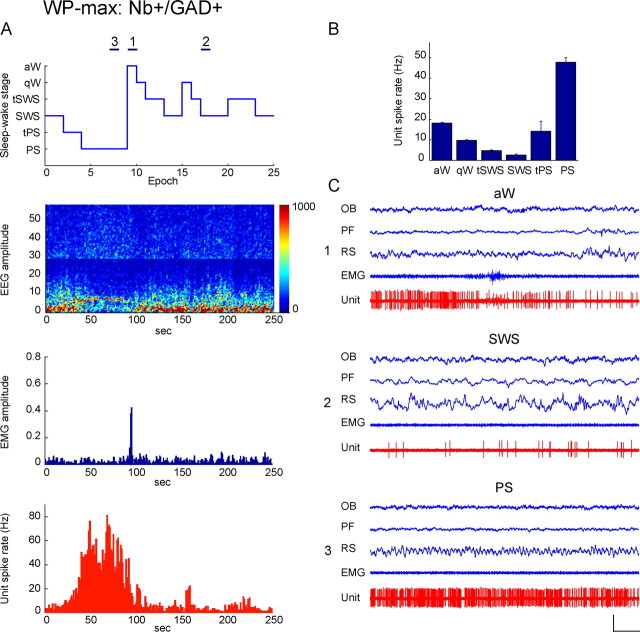
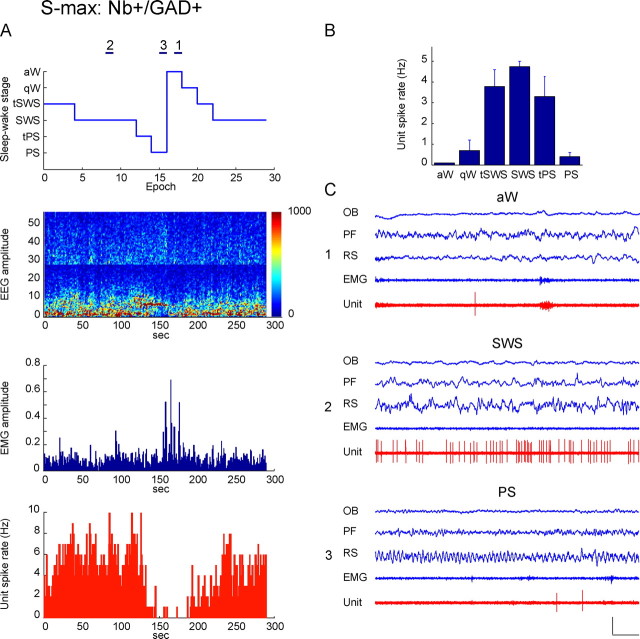
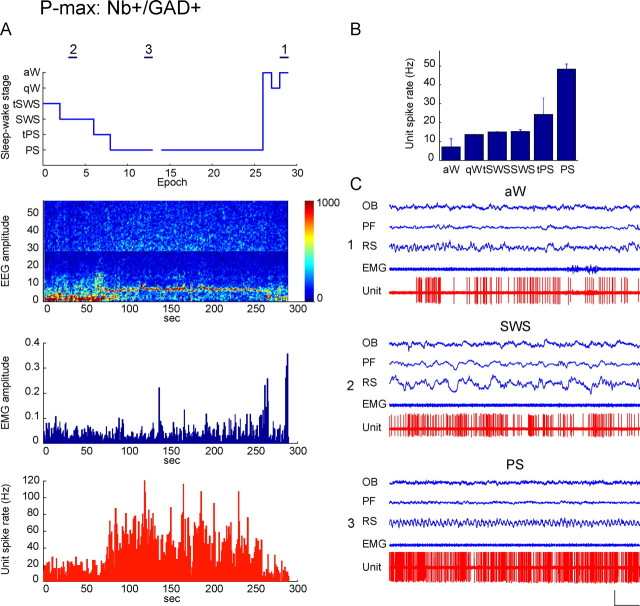
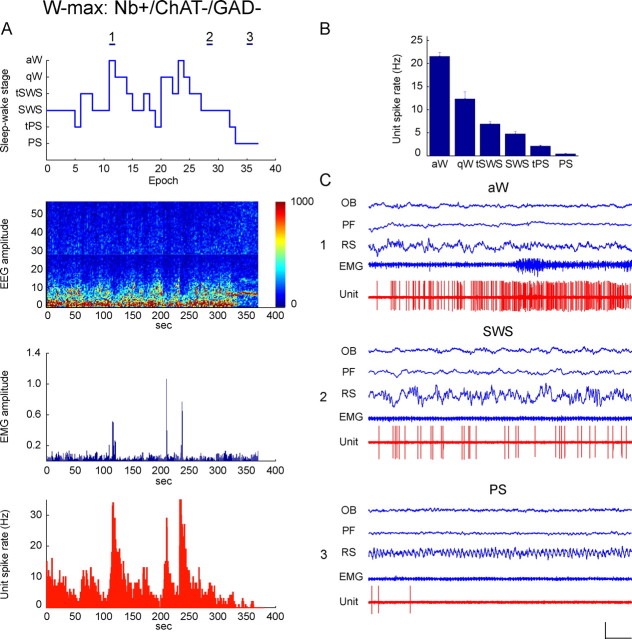
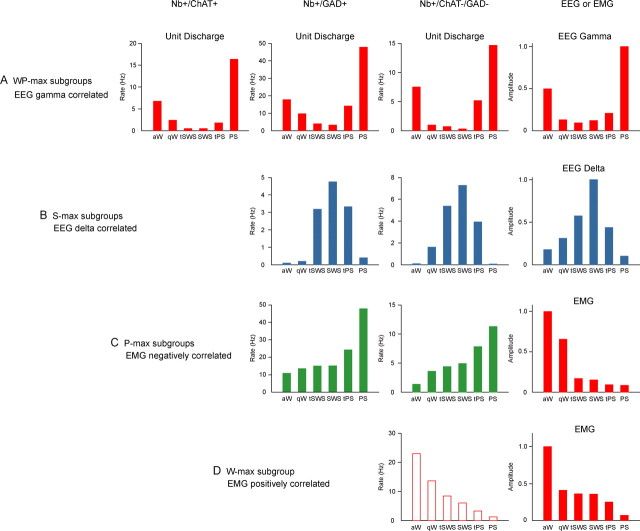
Whereas basal forebrain (BF) cholinergic neurons are known to participate in processes of cortical activation during wake (W) and paradoxical sleep (PS or P, also called REM sleep), codistributed GABAergic neurons have been thought to participate in processes of cortical deactivation and slow-wave sleep (SWS or S). To learn the roles the GABAergic neurons might play, in relation to cholinergic and glutamatergic neurons, we juxtacellularly recorded and labeled neurons during natural sleep-wake states in head-fixed rats. Neurobiotin (Nb)-labeled cells were identified immunohistochemically as choline acetyltransferase (ChAT)+, glutamic acid decarboxylase (GAD)+, or ChAT-/GAD-. Of the latter, some were identified as glutamatergic by immunostaining of their terminals with the vesicular glutamate transporter (VGluT2). In contrast to ChAT+ neurons, which all discharged maximally during W and PS, GAD+ neurons comprised multiple sleep-wake subgroups. Some GABAergic neurons discharged maximally during W and PS, as WP-max active cells (36%), and in positive correlation with gamma electroencephalographic (EEG) activity. Some discharged maximally during SWS, as S-max active cells (28%), and in positive correlation with delta EEG activity. Others increased their discharge progressively during sleep to discharge maximally during PS, as P-max active cells (36%), and in negative association with electromyographic (EMG) activity. ChAT-/GAD- cells comprised WP-max (46%), S-max (17%), P-max (17%), and W-max active cells (14%), whose discharge was positively correlated with EMG activity. GABAergic neurons would thus play similar or reciprocal roles to other cholinergic and glutamatergic BF neurons in regulating cortical activity and muscle tone along with behavior across sleep-wake states.


Figures

Figure 1.
Figure 1.
Images of recorded, Nb-labeled GAD+ neurons. Shown are three Nb+ (A1, B1, and C1, green Cy2, filled arrowheads) revealed as immunopositive for GAD (A2, B2, and C2, red Cy3, filled arrowheads) and located within the BF cholinergic cell area (atlas in insets). A, Nb+/GAD+ unit (c78u10) located in the SI, which discharged maximally during aW and PS, as “WP-max” (shown in Fig. 4). B, Nb+/GAD+ unit (c120u04) located in the MCPO that discharged maximally during SWS, as “S-max” (shown in Fig. 5). C, Nb+/GAD+ unit (c78u11) located in the MCPO, which discharged maximally during PS, as “P-max” (shown in Fig. 6). Shown in the inset to C2, an Nb-labeled axon varicosity found in an adjacent section was also revealed to be immunopositive for VGAT. Scale bar in C2 for all large panels, 20 μm. Scale bar within insets in C2, 2 μm.
Figure 2.
Figure 2.
Images of recorded, Nb-labeled ChAT−/GAD− neurons. A, Nb-labeled unit (c106u05) (A1, green Cy2, filled arrowhead) revealed as immunonegative for ChAT (A2, red Cy3, open arrowhead) and GAD (A3, blue Cy5, open arrowhead), was located in the MCPO (atlas in inset) and discharged maximally during aW, as “W-max” (shown in Fig. 7). B–D, Nb-labeled cell with VGAT-/VGluT2+ terminals (c84u01, B1, green Cy2, filled arrowhead) which was immunonegative for ChAT (B2, red Cy3, open arrowhead) and GAD (B3, blue Cy5, open arrowhead), was located in the MCPO (atlas in inset) and discharged maximally during aW, as “W-max” (data not shown). C, From an adjacent section, Nb-labeled varicosities (C1 and C1′ at slightly different focal planes, green Cy2, arrowheads) along a fiber from the same cell were immunopositive for VGluT2 (C2 and C2′, red Cy3, and C3 and C3′, yellow merged). D, From another adjacent section, another Nb-labeled varicosity (D1, green Cy2, arrowhead) from the same cell was immunonegative for VGAT (D2, red Cy3 and D3, yellow merged). Scale bars in A3 and B3 for A and B, 20 μm. Scale bar in D3 for C and D, 5 μm.
Figure 3.
Figure 3.
Mapping of Nb+ cell types distinguished by sleep–wake subgroup. Nb+/ChAT+ cells (circles), Nb+/GAD+ cells (triangles), and Nb+/ChAT−/GAD− (diamonds) cells (n = 66) were plotted on computer-based atlas sections through the BF [A ∼7.4, 7.8, 8.2, and 8.6 mm from interaural zero (Gritti et al., 2006)]. They were further distinguished according to the sleep–wake state(s) during which they discharged maximally: aW and PS as “WP-max” (WP, filled red), SWS as “S-max” (S, blue), PS as “P-max” (P, green), aW as “W-max” (W, open red), or equivalently as “wsp-eq” (wsp, gray) (see Table 1). A, Amygdaloid area; ac, anterior commissure; AHA, anterior hypothalamic area; BST, bed nucleus of the stria terminalis; CPu, caudate putamen; f, fornix; GP, globus pallidus; ic, internal capsule; LH, lateral hypothalamus; LOT, lateral olfactory tract nucleus; LPO, lateral preoptic area; MCPO, magnocellular preoptic nucleus; MPO, medial preoptic nucleus; oc, optic chiasm; OTu, olfactory tubercle; SIa, substantia innominata pars anterior; SIp, substantia innominata pars posterior. Scale bar, 1 mm.
Figure 4.
Figure 4.
Discharge of Nb+/GAD+, WP-max active unit across sleep–wake states. Data from Nb-labeled cell (c78u10) shown in Figure 1A to be GAD+ and located in the SI. A, Sleep–wake recording scored (per 10 s epoch) for sleep–wake stages is shown with simultaneous EEG amplitude (μV/Hz with frequency on y-axis and amplitude differentially scaled according to color from blue to red, over the low frequency, 0–30 Hz from ∼0 to 100 μV, and the high frequency, ∼30–60 Hz from 0 to 25 μV), EMG amplitude (arbitrary units) and unit spike rate (Hz) over the recording session. Note that the unit discharged during epochs of tPS, PS, and aW, when the EEG was marked by theta activity (4.5–8 Hz) along with gamma (30–58 Hz) and was relatively quiescent during epochs of tSWS and particularly SWS marked by delta EEG activity (1–4.5 Hz). Across stages, its discharge rate was significantly, positively correlated with the amplitude of gamma EEG activity (r = 0.81). Horizontal lines (marked as 1, 2, and 3) indicate 10 s recording epochs of aW, SWS, and PS, respectively, shown in C. B, Bar graph showing mean spike rate (Hz) of the unit across sleep–wake stages. The unit discharged at moderate rates during aW (17.8 Hz), progressively lower rates in qW and the tSWS to reach minimal rates during SWS (3.23 Hz); it increased its discharge during tPS to reach maximal rates during PS (47.76 Hz). C, Polygraphic records from 10 s epochs (indicated in A) of the unit together with EEG and EMG activity during aW (1), SWS (2), and PS (3). Note that during aW, the unit fired in an irregular manner with phasic modulation (C1). It discharged minimally during SWS (C2). It fired tonically at its highest rates during PS though in an irregular manner with some phasic modulation (C3). During this state, the instantaneous firing frequency was very high (90.91 Hz) in a range of bursts. However, its firing did not show rhythmicity (by ACH) or cross-correlation with theta or other EEG activity (by STA) (see supplemental Fig. 2A, available at www.jneurosci.org as supplemental material). Calibrations: horizontal, 1 s; vertical, 1 mV (EEG, EMG), 2 mV (unit). OB, Olfactory bulb; PF, prefrontal cortex; RS, retrosplenial cortex.
Figure 5.
Figure 5.
Discharge of Nb+/GAD+, S-max active unit across sleep–wake states. Data from Nb-labeled cell (c120u04) shown in Figure 1B to be GAD+ and located in the MCPO. A, Sleep–wake recording scored (per 10 s epoch) for sleep–wake stages is shown with simultaneous EEG amplitude (μV/Hz with frequency on y-axis and amplitude scaled according to color as in Fig. 4), EMG amplitude (arbitrary units), and unit spike rate (Hz) over the recording session. Note that the unit discharged during epochs of tSWS and SWS, when the EEG was marked by delta activity (1–4.5 Hz), and was virtually silent during epochs of aW and PS, when the EEG was marked by theta (4.5–8 Hz). Across sleep–wake stages, the unit's discharge rate was significantly, positively correlated with delta EEG amplitude (r = 0.60). Horizontal lines (marked as 1, 2, or 3) indicate 10 s epochs of aW, SWS, or PS, respectively, shown in C. B, Bar graph showing mean spike rate (Hz) of the unit across sleep–wake stages. The unit discharged at minimal rates during aW (0.1 Hz), increased slightly during qW, then increased substantially with tSWS to reach the highest rates during SWS (4.74 Hz), decrease slightly during tPS and decrease substantially during PS (0.4 Hz). C, Polygraphic records from 10 s epochs (indicated in A) of the unit spiking together with EEG and EMG activity during aW (1), SWS (2), and PS (3). Note that the unit was virtually silent during aW and PS (C1 and C3). It discharged during SWS (C2) in a tonic irregular manner with an instantaneous firing frequency (10.53 Hz) indicative of groups of spikes. However, this pattern of firing did not show any rhythmicity (by ACH) or cross-correlation (by STA) with delta or other EEG activity during SWS (see supplemental Fig. 2B, available at www.jneurosci.org as supplemental material). Calibrations: horizontal, 1 s; vertical, 1 mV (EEG, EMG), 2 mV (unit). OB, Olfactory bulb; PF, prefrontal cortex; RS, retrosplenial cortex.
Figure 6.
Figure 6.
Discharge of Nb+/GAD+, P-max active unit across sleep–wake states. Data from Nb-labeled cell (c78u11) shown in Figure 1C to be GAD+, to contain VGAT in its terminals and to be located in the MCPO. A, Sleep–wake recording scored (per 10 s epoch) for sleep–wake stages is shown with simultaneous EEG amplitude (μV/Hz with frequency on y-axis and amplitude scaled according to color as in Fig. 4), EMG amplitude (arbitrary units), and unit spike rate (Hz) over the recording session. Note that across sleep–wake stages, the unit discharged maximally during epochs of tPS and PS when the EEG was marked by theta (4.5–8 Hz) and EMG amplitude was relatively low. The unit discharge rate was significantly, negatively correlated with EMG amplitude (r = −0.53). Horizontal lines (marked as 1, 2, or 3) indicate 10 s epochs of aW, SWS, or PS, respectively, shown in C. B, Bar graph showing mean spike rate (Hz) of the unit in sleep–wake stages. The unit discharged during all stages at the lowest during aW (10.7 Hz), slightly higher during qW, tSWS, and SWS (14.85 Hz), increasing rates during tPS to discharge at a substantially higher and maximal rate during PS (48.05 Hz). C, Polygraphic records from 10 s epochs (indicated in A) of the unit discharge together with EEG and EMG activity during aW (1), SWS (2), and PS (3). Note that the unit discharged across states in a tonic irregular manner, most irregular in aW (C1) and more tonically at a higher rate in SWS (C2), reaching maximal rates during PS (C3). In this state, its instantaneous firing frequency is very high (142.86 Hz) in a range of bursts. There was, however, no evidence of rhythmicity (by ACH) of the bursting or cross-correlation (by STA) with theta or any other EEG activity (see supplemental Fig. 2C, available at www.jneurosci.org as supplemental material). Calibrations: horizontal, 1 s; vertical, 1 mV (EEG, EMG), 2 mV (unit). OB, Olfactory bulb; PF, prefrontal cortex; RS, retrosplenial cortex.
Figure 7.
Figure 7.
Discharge of Nb+/ChAT−/GAD−, W-max active unit across sleep–wake states. Data from Nb-labeled cell (c106u05) shown in Figure 2A to be ChAT−/GAD− and located in the MCPO. A, Sleep–wake recording scored (per 10 s epoch) for sleep–wake stages is shown with simultaneous EEG amplitude (μV/Hz with frequency on y-axis and amplitude scaled according to color as in Fig. 4), EMG amplitude (arbitrary units), and unit spike rate (Hz) over the recording session. Note that the unit discharged maximally during epochs of aW, when the EMG amplitude was high. It decreased firing with the passage through qW, tSWS, SWS into PS, when it reached minimal levels. Across stages, its discharge rate was significantly, positively correlated with the EMG amplitude (r = 0.49). Horizontal lines (marked as 1, 2, and 3) indicate 10 s recording epochs of aW, SWS, and PS, respectively, shown in C. B, Bar graph showing mean spike rate (Hz) of the unit across sleep–wake stages. The unit discharged at its highest rate during aW (22.95 Hz), decreased firing progressively during qW through tSWS, SWS, and into tPS to reach its minimal rate during PS (1.24 Hz). C, Polygraphic records from 10 s epochs (indicated in A) of the unit together with EEG and EMG activity during aW (1), SWS (2), and PS (3). Note that during aW, the unit fired at its highest rates in a tonic but irregular manner (C1). It greatly diminished firing during SWS (C2) and was virtually silent during PS (C3). During aW, the instantaneous firing frequency was moderately high (47.6 Hz) reflecting a phasic modulation of its discharge. However, its firing did not show rhythmicity (by ACH) or cross-correlation with theta or other EEG activity (by STA) (see supplemental Fig. 2D, available at www.jneurosci.org as supplemental material). Calibrations: horizontal, 1 s; vertical, 1 mV (EEG, EMG), 2 mV (unit). OB, Olfactory bulb; PF, prefrontal cortex; RS, retrosplenial cortex.
Figure 8.
Figure 8.
Average discharge rates across sleep–wake stages of different cell types and subgroups in relation to EEG and EMG activity. A, WP-max cells discharged maximally during aW and PS when EEG gamma amplitude was maximal (as shown on right for cell c74u03) across sleep–wake stages. They included cholinergic (Nb+/ChAT+ cell c30u13 from (Lee et al., 2005b)), GABAergic (Nb+/GAD+ cell c78u10 from Fig. 4) and putative glutamatergic (Nb+/ChAT−/GAD− cell c74u03) BF neurons, whose discharge rate was positively correlated with gamma activity (r = 0.76, 0.81, and 0.84, respectively) and could thus promote cortical activation during W and PS. B, S-max cells discharged maximally during SWS when EEG delta amplitude was maximal (as shown on right for cell c104u01) across sleep–wake stages. They included GABAergic (Nb+/GAD+ cell c120u04 from Fig. 5) and putative glutamatergic (Nb+/ChAT−/GAD− cell c104u01) BF neurons, whose discharge rate was positively correlated with delta activity (r = 0.60 and 0.74, respectively) and could thus promote delta activity and/or reciprocally dampen gamma activity during SWS. C, P-max cells discharged maximally during PS when EMG amplitude was minimal (as shown on right for c70u12) across sleep–wake stages. They included GABAergic (Nb+/GAD+ cell c78u11 from Fig. 6) and putative glutamatergic (Nb+/ChAT−/GAD− cell c70u12) BF neurons, whose discharge rate was negatively correlated with EMG amplitude (r = −0.53 and −0.57, respectively) and could thus promote muscle atonia along with behavioral quiescence during sleep. D, W-max cells discharged maximally during aW when EMG amplitude was maximal (as shown on right for c106u05) across sleep–wake stages. They included only putative glutamatergic (Nb+/ChAT−/GAD− cell, c106u05 from Fig. 7) BF neurons, whose discharge rate was positively correlated with EMG amplitude (r = 0.49) and could thus promote muscle tone along with behavioral arousal during waking. Bar charts of unit average discharge rates present data from representative cells of each subgroup (see Table 3), and those of EEG and EMG amplitudes (right) present corresponding data from the Nb+/ChAT−/GAD− cells.

References

    1. Berntson GG, Shafi R, Sarter M. Specific contributions of the basal forebrain corticopetal cholinergic system to electroencephalographic activity and sleep/waking behaviour. Eur J Neurosci. 2002;16:2453–2461. - PubMed
    1. Blanco-Centurion C, Gerashchenko D, Shiromani PJ. Effects of saporin-induced lesions of three arousal populations on daily levels of sleep and wake. J Neurosci. 2007;27:14041–14048. - PMC - PubMed
    1. Duque A, Balatoni B, Detari L, Zaborszky L. EEG correlation of the discharge properties of identified neurons in the basal forebrain. J Neurophysiol. 2000;84:1627–1635. - PubMed
    1. Fremeau RT, Jr, Troyer MD, Pahner I, Nygaard GO, Tran CH, Reimer RJ, Bellocchio EE, Fortin D, Storm-Mathisen J, Edwards RH. The expression of vesicular glutamate transporters defines two classes of excitatory synapse. Neuron. 2001;31:247–260. - PubMed
    1. Freund TF, Meskenaite V. Gamma-aminobutyric acid-containing basal forebrain neurons innervate inhibitory interneurons in the neocortex. Proc Natl Acad Sci U S A. 1992;89:738–742. - PMC - PubMed

Publication types