. 2009 Sep 23;29(38):11891-903.
doi: 10.1523/JNEUROSCI.5250-08.2009.

Encoding and decoding bursts by NMDA spikes in basal dendrites of layer 5 pyramidal neurons

Affiliations

Encoding and decoding bursts by NMDA spikes in basal dendrites of layer 5 pyramidal neurons

Alon Polsky et al. J Neurosci. .

Abstract

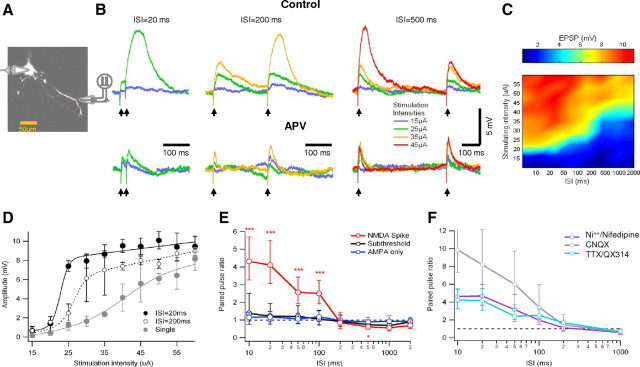
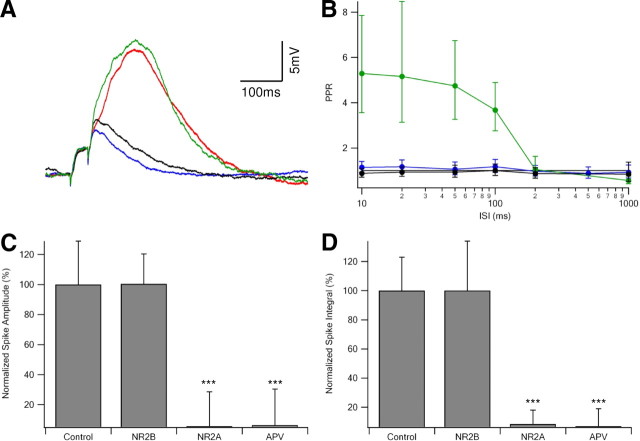
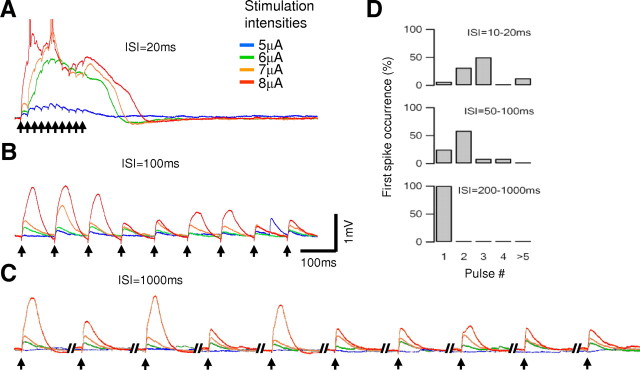
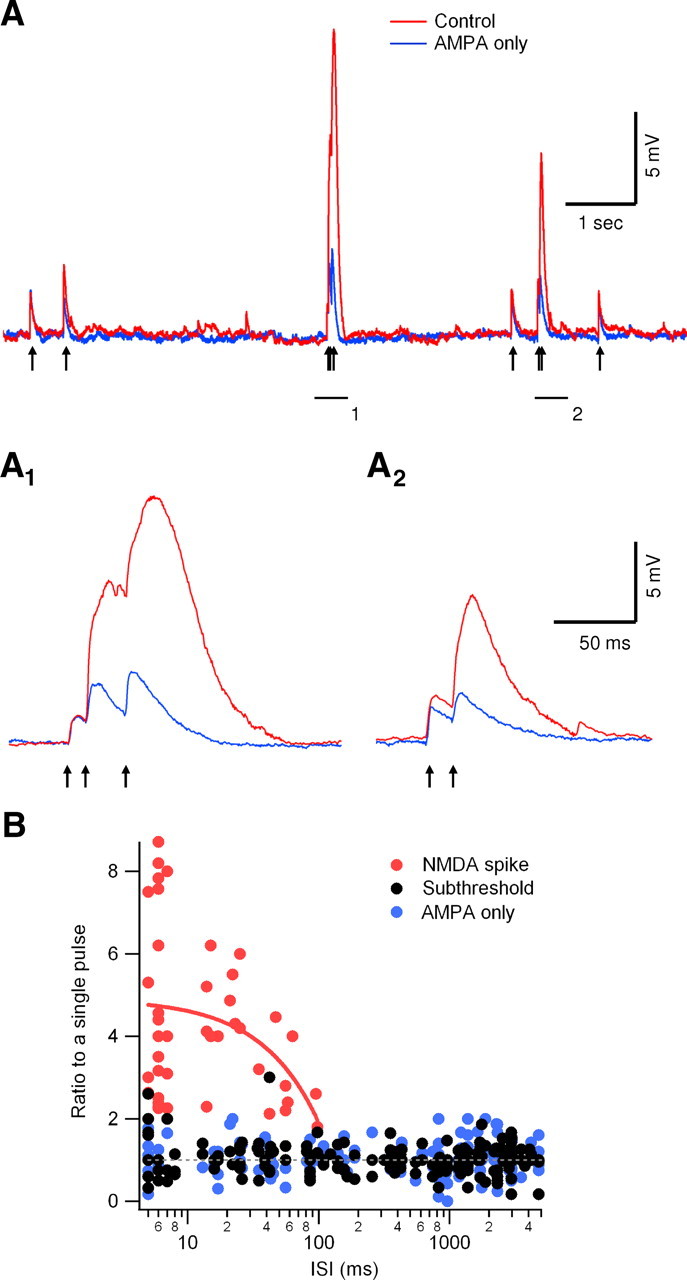
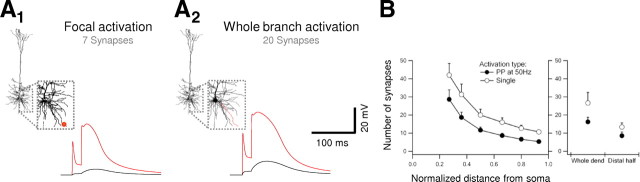
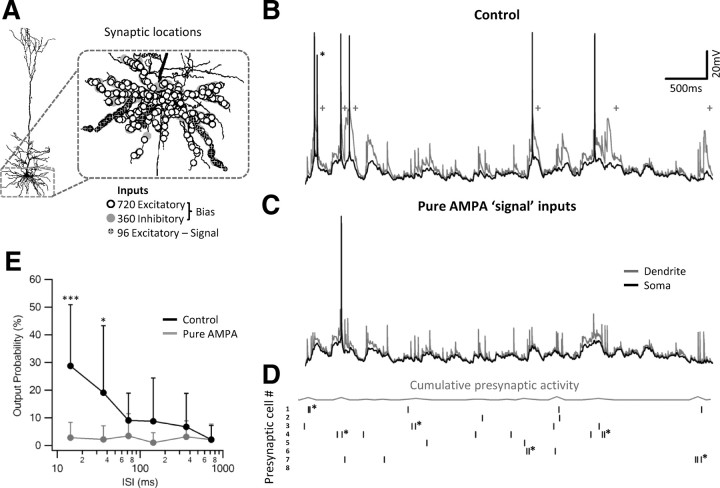
Bursts of action potentials are important information-bearing signals in the brain, although the neuronal specializations underlying burst generation and detection are only partially understood. In apical dendrites of neocortical pyramidal neurons, calcium spikes are known to contribute to burst generation, but a comparable understanding of basal dendritic mechanisms is lacking. Here we show that NMDA spikes in basal dendrites mediate both detection and generation of bursts through a postsynaptic mechanism. High-frequency inputs to basal dendrites markedly facilitated NMDA spike initiation compared with low-frequency activation or single inputs. Unlike conventional temporal summation effects based on voltage, however, NMDA spike facilitation depended mainly on residual glutamate bound to NMDA receptors from previous activations. Once triggered by an input burst, we found that NMDA spikes in turn reliably trigger output bursts under in vivo-like stimulus conditions. Through their unique biophysical properties, NMDA spikes are thus ideally suited to promote the propagation of bursts through the cortical network.


Figures

Figure 1.
Figure 1.
Frequency-dependent amplification in basal dendrites as shown using paired-pulse stimulation. A, Experimental setup. Whole-cell voltage-clamp recordings were performed from the soma. The cell was loaded with OGB-1 (200 μm) and was visualized using fluorescence confocal microscopy. Paired-pulse synaptic stimulation was performed via extracellular theta electrode placed under visual control near selected basal dendrites. B, Voltage responses to paired-pulse stimulations with different interstimulus intervals (ISI of 20–500 ms). Top traces were recorded in control conditions, and bottom traces were recorded in the presence of the NMDAR blocker APV (100 μm). Stimulus intensity was gradually changed at each ISI and presented in color coding (see inset). For clarity, only the lowest stimulus intensity that produced NMDA spike is shown for each ISI. Note that spikes were elicited preferentially by the second stimulus when ISIs were between 20 and 200 ms. For larger ISIs (500 ms), spikes were evoked at the first pulse. Addition of APV abolished all regenerative responses. C, Surface plot of the peak somatic EPSP amplitude evoked for all ISIs and stimulating intensities for the cell shown in B. Note the raise in voltage threshold for NMDA spike initiation as the ISI increased. D, Peak EPSP amplitude is plotted as a function of the stimulus intensity for the cell shown in B. Two ISIs (black, 20 ms; dotted line, 200 ms) and single pulse (gray) are presented. Data are shown as average ± SD. E, Summary plot of PPR as a function of ISIs (n = 10) for subthreshold responses (black), stimulations that triggered NMDA spike (red) and synaptic stimulation in the presence of APV (blue). To prevent spurious PPR, the average and SD were calculated in logarithmic scale. Note that, for stimulations that triggered NMDA spikes, strong facilitation is evident for ISIs smaller than 200 ms and paired-pulse depression for larger ISIs. The asterisks note statistical significance. F, Sodium and calcium blockers do not affect the PPR for all ISIs tested. PPR ± SD in the presence of somatic TTX or intracellular QX-314 (magenta; n = 8), the voltage-gated calcium channel blockers nifedipine and nickel (purple; n = 4), and CNQX (gray; n = 10). For clarity, only trials in which NMDA spike was present in either pulse were taken into account. The application of CNQX resulted in extremely high PPR at the short ISIs as the blocker markedly decreased the first EPSP without affecting spike amplitude.
Figure 2.
Figure 2.
NMDA spikes are mediated by NMDAR with NR2A subunits. A, Paired-pulse (ISI of 20 ms) synaptic stimulation at an intensity sufficient to trigger an NMDA spike during control conditions (red), after bath application of the NR2B blocker ifenprodil (3 μm; green), followed by bath application of NR2A antagonist NVP-AAM077 (0.4 μm; black), and finally by APV (100 μm; blue). Stimulus intensity was identical for all traces shown. B, Maximal PPR ± SD at different ISIs, with ifenprodil (3–5 μm) or Ro25-6981 (0.5 μm; n = 7; green), and NVP-AAM077 (0.4 μm; n = 4; black). In two cells, successive application of NR2B and NR2A blockers as shown in A was given. C, D, Summary of the effect of different NR2 antagonists on NMDA spike amplitude (C) and area under the curve (D). Spikes were normalized to the average spike amplitude (or area under the curve) in control conditions, when no antagonist was present (n = 6 for NVP-AAM077 and 11 for ifenprodil or Ro25-6981). Complete NMDAR block by APV (100 μm; n = 5) is shown for comparison. Blockage of NR2B subunit receptors had little, if any, effect on dendritic spike, whereas both NVP-AAM077 and APV eliminated the spike (p < 0.001 compared with control).
Figure 3.
Figure 3.
Temporal summation rules for long pulse trains. A–C, Voltage responses to long input trains (10 pulses at 4 different stimulating intensities of 5, 6, 7, and 8 μA; color coding is shown on the right) were given with an ISI of 20 ms (A), 100 ms (B), and 1000 ms (C); arrows denote timing of stimuli. Somatic action potentials are truncated. Note that, during high-frequency stimulations (ISIs of <50 ms) plateau potentials were initiated. In addition, occurrence of NMDA spikes inhibited spikes in subsequent pulses for ISI of 100 ms and especially 1000 ms. D, The stimulus pulse number in which NMDA spikes were initiated by the lowest stimulation intensity. Note that high-frequency inputs initiated spikes at the second or the third input, but for longer ISIs, the spike always occurred initially at the first pulse (n = 6).
Figure 4.
Figure 4.
Integration of synaptic inputs driven by in vivo-like down-state stimulation patterns. A, Timing of action potentials (arrows) were extracted from a layer 5 pyramidal neuron in vivo recording and used to drive the extracellular stimulation electrode. Responses under control conditions (red) and in the presence of APV (blue; 100 μm) are shown. A1, A2, Enlargement of the two underlined regions of the trace shown in A. B, Summary plot of the ratio between NMDA spikes (red circles), subthreshold EPSPs (black circles) to a single pulse (7 cells) in control and with APV (blue circles). NMDA spike initiation was dependent on ISI; on average, the time window for spike initiation was 72.2 ± 7.7 ms (n = 7). The red line is a linear regression analysis of the ratio between NMDA spike and control prepulse amplitudes (note the logarithmic scale of the x-axis).
Figure 5.
Figure 5.
Input–output function under in vivo-like up-state stimulation patterns. A1, Experimental setup. Whole-cell voltage-clamp recordings were performed from the soma of a layer 5 pyramidal neuron. The cell was loaded with OGB-1 (200 μm) and was visualized using fluorescence confocal microscopy. A2, Somatic voltage response to a 500-ms-long somatic current step (0.3 nA) showing the firing pattern of the neuron. A3, Synaptic stimulations were performed via extracellular theta electrode placed under visual control near selected basal dendrite. The stimulation intensity was set to initiate a local NMDA spike with paired-pulse stimulation (ISI of 20 ms). B, A 4-s-long trace recorded in vivo from a layer 5 pyramidal neuron (after truncation of action potentials; B4) was played back to the soma of the cell shown in A. Action potential firing pattern, extracted from a different in vivo recording, served to drive the stimulation of the basal dendrite (B5, arrows); asterisks mark burst firing. The postsynaptic voltage recording evoked by the in vivo-like stimulation pattern is shown in control conditions (B1) and in the presence of 100 μm APV (B2). Bursts of postsynaptic action potentials were readily evoked under control conditions (marked by asterisks; B1). In the presence of APV, the cell had to be depolarized by 8 mV above rest to initiate reliable postsynaptic firing (B3). Under these conditions, the resulting somatic output was most often in the form of a single action potential. Arrows mark the postsynaptic output.
Figure 6.
Figure 6.
Suprathreshold input–output function after activation of a single basal branch: effect of NMDA spikes. A, The percentage of the presynaptic inputs that successfully triggered postsynaptic firing as a function of the input ISI (n = 6 cells). B, ISI distribution of postsynaptic somatic action potentials (shaded histogram; n = 287 events recorded in 6 cells) and the input ISIs (open histogram; 957 events). C, The probability of evoking a given number of postsynaptic action potentials (AP) after high-frequency (ISI of <50 ms) or low-frequency (ISI of >200 ms) presynaptic stimulation. There was a statistically significant change between the output behavior for high- and low-frequency inputs (p < 0.001, χ test). Inset, Zoom on the firing probability flowing low-frequency stimulation. D, Similar to A in the presence of 100 μm APV. Gray traces represent measurements at control resting potential. Black trace, Similar experiment assisted by 8–10 mV somatic depolarization. E, Similar to B, in the presence of 100 μm APV (n = 4 cells, output; n = 197 somatic action potentials; input, 802 stimulations). F, Similar to C in the presence of 100 μm APV and depolarization. The output pattern was not significantly different between high and low stimulation frequencies (p = 0.22, χ test).
Figure 7.
Figure 7.
Manipulations of the residual voltage during frequency activation. A, Stimulation of a basal dendrite located 120 μm from the soma in the presence of 20 μm CNQX. Membrane potential was controlled by somatic current injections. Stimulation intensity was increased until NMDA spike was initiated by paired-pulse stimulation protocol (ISI of 20 ms). Note that, with a single pulse at the same intensity the voltage remained subthreshold (gray, control resting potential). To simulate the effect of the residual depolarization on NMDA spike initiation, 10 mV somatic depolarization was applied during single-pulse stimulation (green). To cancel the contribution of first-pulse depolarization on NMDA spike initiation during paired-pulse stimulation, voltage was hyperpolarized by 10 mV (red). The stimulation intensity was kept constant for all traces shown. B, Summary plot of normalized peak EPSP amplitude as a function of the normalized stimulus intensity (5 cells) at control paired-pulse stimulation (ISI of 20 ms; filled black circles), single-pulse stimulation (open black circles), and single-pulse stimulation paired to 8–15 mV depolarization (green). All responses were normalized by the average NMDA spike amplitude, and stimulation intensities were normalized by the lowest intensity that triggered NMDA spike in paired-pulse stimulation protocol (ISI of 20 ms). The data were fitted by a sigmoid function (black filled for paired-pulse stimulation, black dotted for single-pulse stimulations, green line for single-pulse stimulation paired to depolarization). Somatic depolarization (8–15 mV) assisted NMDA spike initiation, but the stimulus intensity needed to initiate a spike was on average more than twofold higher than in control paired-pulse conditions. C, Same as B except that the paired-pulse stimulation was delivered in the presence of somatic hyperpolarization of 10–20 mV (red dots, red line shows the sigmoid fit). Note that the stimulation intensities needed to initiate the NMDA spike increased by only 22%.
Figure 8.
Figure 8.
Computer simulation of the frequency-dependent amplification in basal dendrites. A, Three-dimensional reconstruction of a layer 5 pyramidal cell recorded in B–D; dendritic stimulation site is marked with a blue circle. This cell was used to create NEURON simulations shown in B–G. B, C, Comparison of actual (gray) and simulated (black) paired-pulse voltage responses to stimulations with ISI of 20 ms (B) and 200 ms (C). Experimental data were obtained in the presence of CNQX (20 μm). Close agreement between the experiment and the simulation were evident in all stimulation frequencies tested. D, Peak EPSP amplitude is plotted as a function of the stimulus intensity for paired-pulse stimulation (ISI of 20 ms; experimental data, gray squares; simulation, connected black circles) and for a single pulse (experiment, open squares; simulation, connected open circles). E, Manipulations of the dendritic voltage during single- and paired-pulse stimulations. Control curve during paired pulse (black filled circles) and single pulse (black open circles). During the paired-pulse protocol, the pan-cellular voltage was reset to the resting potential just before the onset of the second pulse (filled red circles). This manipulation increased the NMDA current needed to initiate a spike by only 2%. When the first synaptic pulse was substituted by equivalent local depolarization, NMDA spike initiation threshold increased by 46% (green). Schematic illustration of the different stimulation protocols are shown in the inset in F. F, Plot of the minimal peak NMDA conductance sufficient to initiate a dendritic spike for different ISIs. The dotted line represents the threshold for spike initiation by a single pulse. Paired-pulse stimulations with residual voltage reset to rest (red) were almost as effective as control paired-pulse stimulations (black). G, Same as in F except that AMPA conductance was included in the model. Color coding is as in F. Insets shows the somatic voltage of the “just suprathreshold” stimulation in NMDA only (F) and AMPA/NMDA conditions (G). Schematic illustration of the different stimulation protocols are shown in the inset.
Figure 9.
Figure 9.
Spatiotemporal conditions for spike initiation. A, Effect of spatial distribution of synapses within a single branch on initiation of NMDA spikes. A1, Example of the dendritic (red) and somatic (black) potentials after paired-pulse stimulation (ISI of 20 ms) of seven synapses located within 20 μm dendritic segment length with mean somatic distance of 256 μm from the soma. A2, Somatic and dendritic potentials after paired-pulse activation of 20 simulated synapses distributed randomly over the whole dendrite (marked in red in the inset). Note that both stimulations initiated NMDA spike at the second pulse. Dendritic voltage in both cases was measured at a distance of 256 μm from the soma. B, Left, The minimal number of synapses needed to initiate NMDA spike after focal paired-pulse (ISI of 20 ms; filled circles) or single-pulse (open circles) stimulations versus stimulation distance from the soma (n = 6 dendrites). Right, The number of synapses needed to initiate a spike for synapses distributed on the whole dendritic length (Whole dend) or the distal half of the dendrite (Distal half).
Figure 10.
Figure 10.
Effect of a small network of presynaptic neurons on the postsynaptic firing pattern of a layer 5 pyramidal neuron. A, Simulation setup and synaptic locations on the three-dimensional reconstruction of a layer 5 pyramidal neuron. Basal dendritic tree was contacted by 720 excitatory (open circles) and 360 inhibitory (gray circles) background inputs, firing at random with a mean firing rate of 1 Hz. The signal inputs originated from eight presynaptic neurons, each neuron having 12 synaptic contacts distributed at random locations on three postsynaptic basal branches (squares), altogether 96 inputs. B, Five-second-long dendritic (gray) and somatic (black) simulated voltage recording during activation of the presynaptic inputs by in vivo recorded firing pattern (D) showing generation of dendritic NMDA spikes (marked by pluses), somatic action potentials, and bursts (marked with an asterisk). With this firing pattern, presynaptic activity readily triggered NMDA spikes, which in turn effectively generated somatic firing. C, Similar to B but with AMPA-only synapses. The postsynaptic somatic firing rate was greatly reduced. D, Raster plot of the presynaptic activity of the eight signal neurons. The cumulative presynaptic firing rate (in bins of 100 ms) is shown by a gray curve on top. Asterisks mark presynaptic bursts. E, The percentage of the presynaptic inputs that successfully triggered postsynaptic firing as a function of the input ISI for control (black) and AMPA-only inputs (gray) conditions. High-frequency inputs significantly increased the probability for postsynaptic response in control but not in AMPA-only condition.

Similar articles

Cited by

References

    1. Abbott LF, Regehr WG. Synaptic computation. Nature. 2004;431:796–803. - PubMed
    1. Akopian G, Walsh JP. Corticostriatal paired-pulse potentiation produced by voltage-dependent activation of NMDA receptors and L-type Ca2+ channels. J Neurophysiol. 2002;87:157–165. - PubMed
    1. Azouz R, Jensen MS, Yaari Y. Ionic basis of spike after-depolarization and burst generation in adult rat hippocampal CA1 pyramidal cells. J Physiol. 1996;492:211–223. - PMC - PubMed
    1. Birtoli B, Ulrich D. Firing mode-dependent synaptic plasticity in rat neocortical pyramidal neurons. J Neurosci. 2004;24:4935–4940. - PMC - PubMed
    1. Cattaneo A, Maffei L, Morrone C. Two firing patterns in the discharge of complex cells encoding different attributes of the visual stimulus. Exp Brain Res. 1981;43:115–118. - PubMed

Publication types

MeSH terms

LinkOut - more resources