. 2009 Sep 23;29(38):11912-23.
doi: 10.1523/JNEUROSCI.2971-09.2009.

AMPA receptor ligand binding domain mobility revealed by functional cross linking

Affiliations

AMPA receptor ligand binding domain mobility revealed by functional cross linking

Andrew J R Plested et al. J Neurosci. .

Abstract

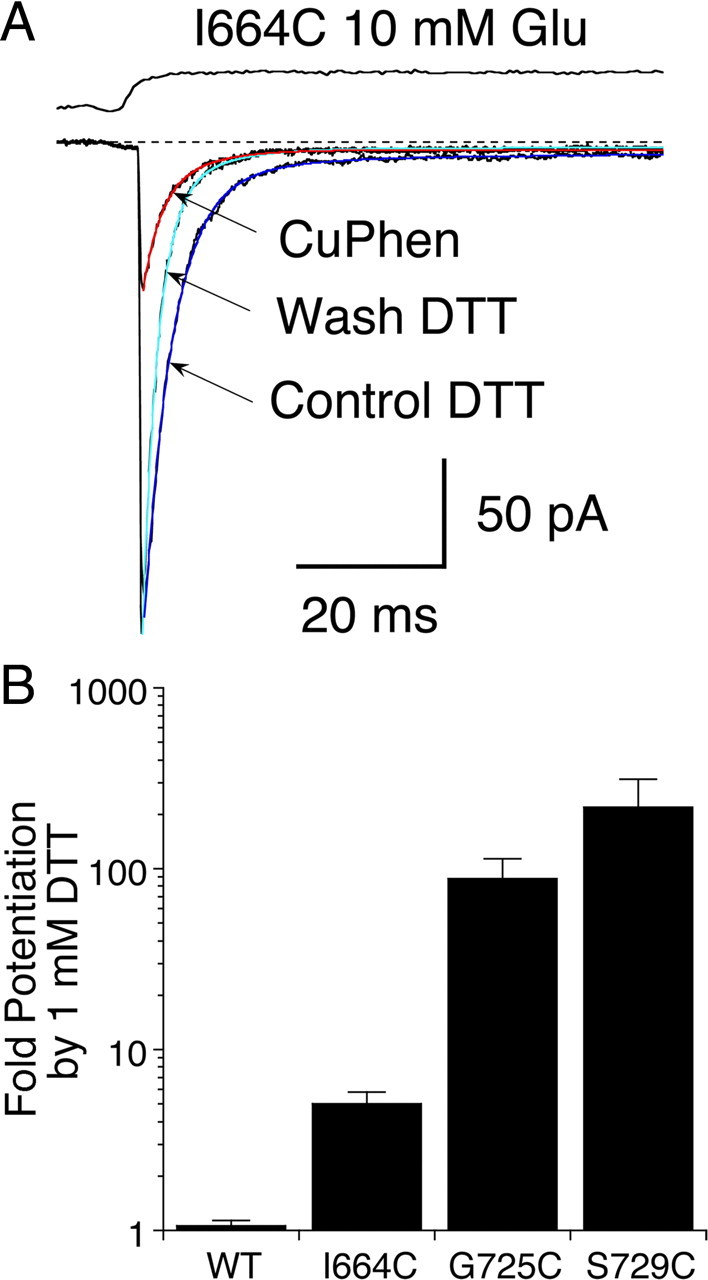
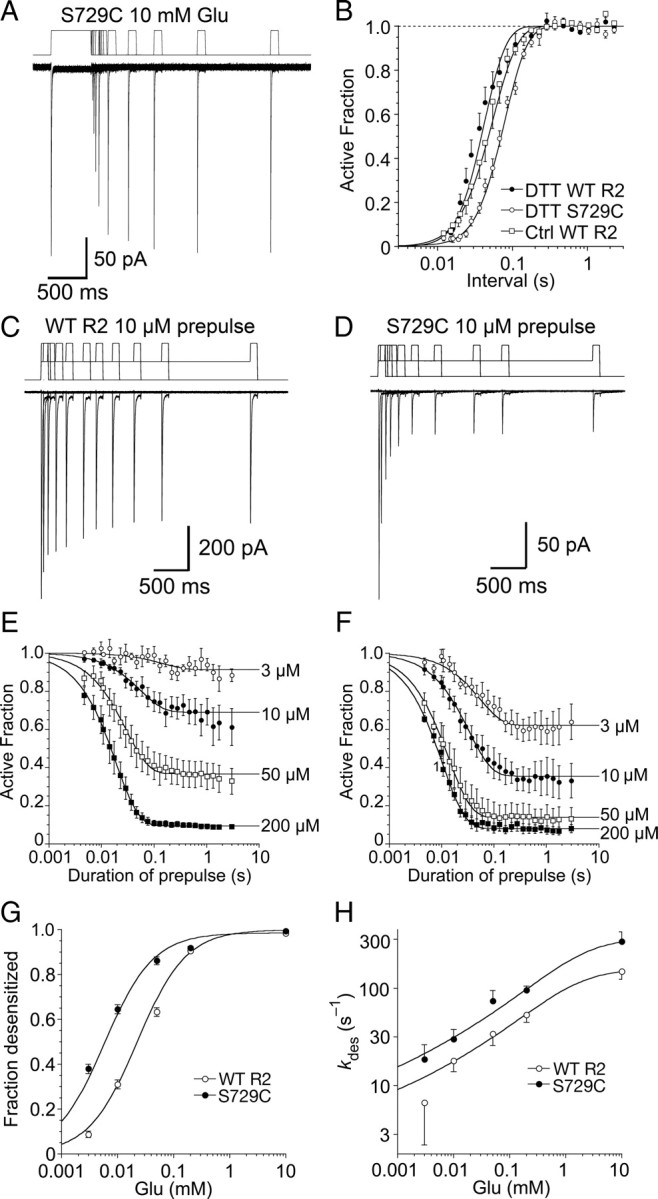
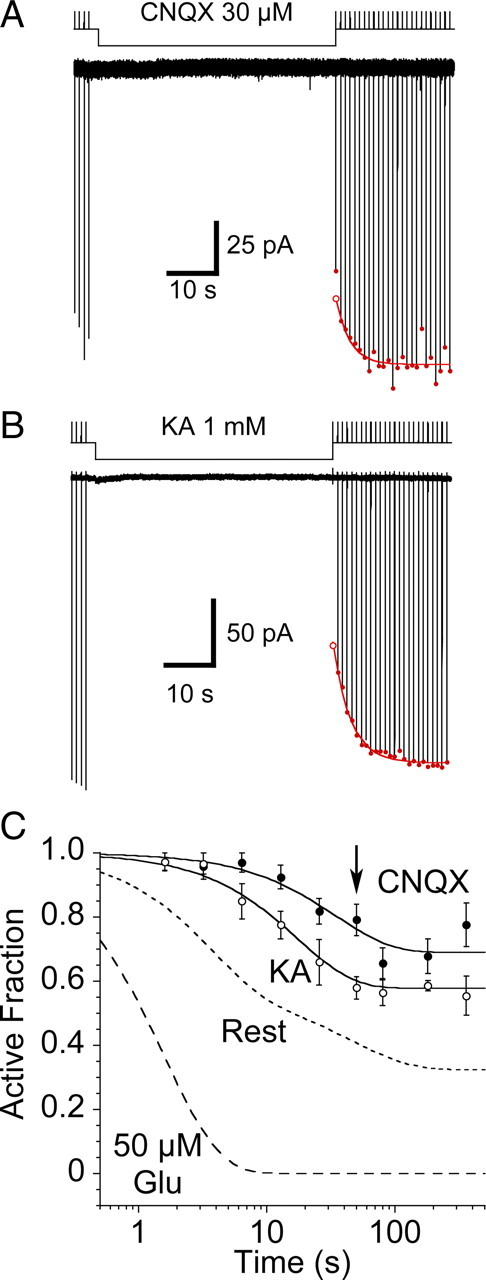
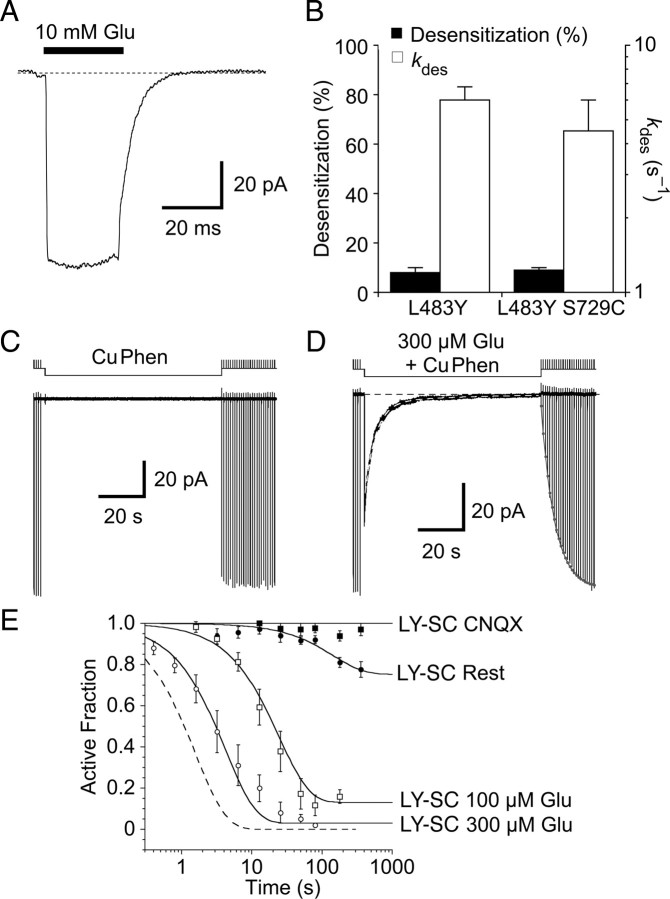
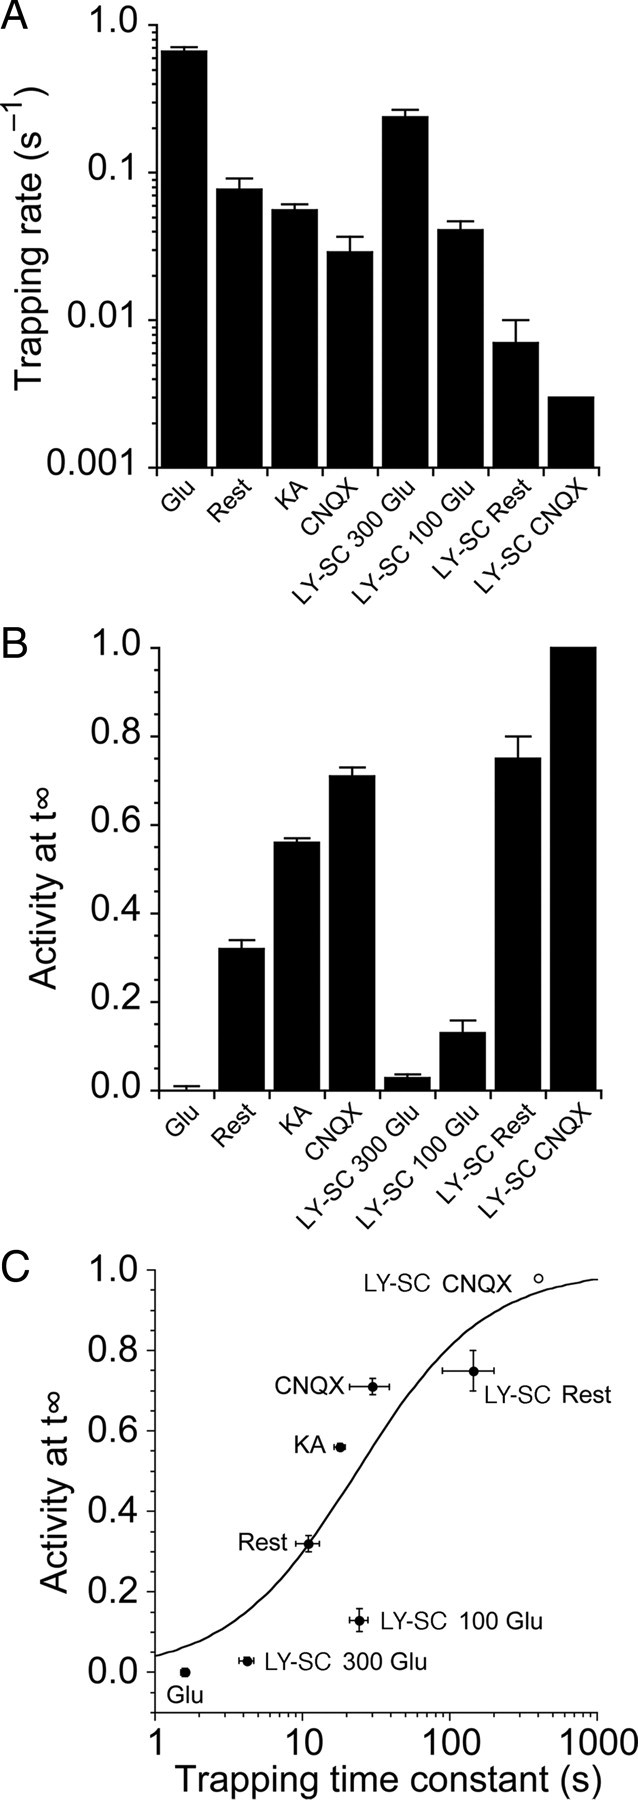
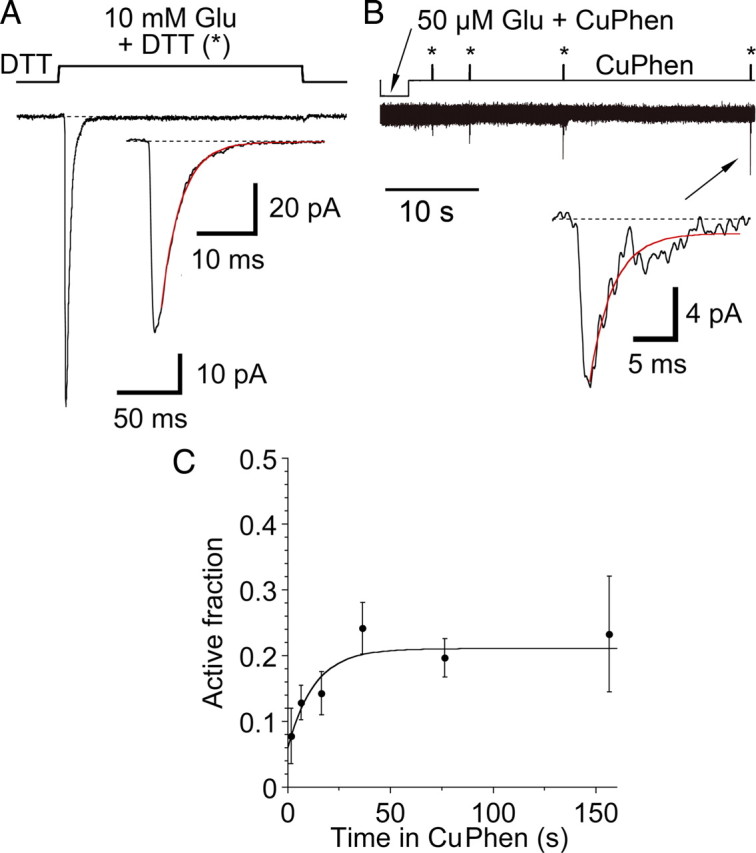
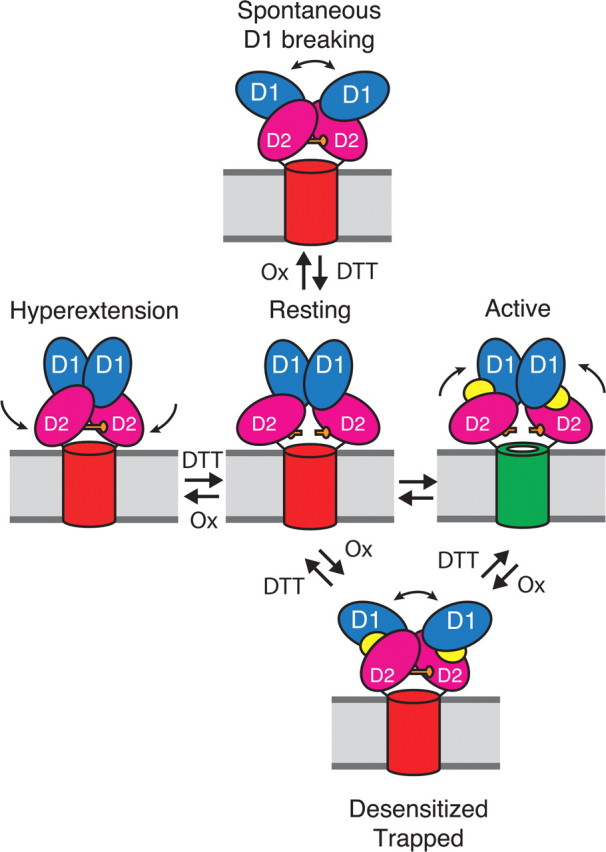
Glutamate receptors mediate the majority of excitatory synaptic transmission in the CNS. The AMPA-subtype has rapid kinetics, with activation, deactivation and desensitization proceeding on the millisecond timescale or faster. Crystallographic, biochemical, and functional studies suggest that GluR2 Cys mutants which form intermolecular disulfide cross-links between the lower D2 lobes of the ligand binding cores can be trapped in a conformation that represents the desensitized state. We used multi-channel rapid perfusion techniques to examine the state dependence of cross-linking in these mutants. Under reducing conditions, both wild-type GluR2 and the G725C and S729C mutants have normal activation and desensitization kinetics, but the Cys mutants can be efficiently trapped in nonconducting states when oxidized. In contrast the I664C mutant is only partially inactivated under oxidizing conditions. For S729C, disulfide cross-links form rapidly when receptors are desensitized in the presence of glutamate, but receptors also become trapped at rest, in the absence of agonist. We assessed such spontaneous trapping in various conditions, including CNQX, a competitive antagonist; kainate, a weak partial agonist; or when desensitization was blocked by the L483Y mutation that stabilizes the D1 dimer interface. These experiments suggest that trapping in the absence of glutamate is due to two motions: Spontaneous breaking of the D1 dimer interface and hyperextension of the lower lobes of the ligand binding core. These data show that the glutamate binding domains are surprisingly mobile in the absence of ligand, which could influence receptor activity in the brain.


Figures

Figure 1.
Figure 1.
Redox sensitivity of wild-type GluR2 and the G725C and S729C mutants. A, Crystal structure of the GluR2 ligand binding dimer glutamate complex (PDB 1FTJ) in which domains 1 and 2 in each subunit are colored blue and pink, respectively; orange spheres separated by 16 Å indicate the wide separation of the CA atoms of the G725C mutant in the glutamate bound active state. B, Diagram representation of the ligand binding domain and ion channel in the glutamate bound open state; the introduced cysteine residues are shown as orange bars. C, Activation and desensitization of wild-type GluR2 is not affected by redox potential; the colored lines show single exponential fits to the decay of the response to glutamate; the rise time and rate of desensitization for glutamate responses in control conditions, kdes 129 s−1 (blue), was indistinguishable from that in 10 μm CuPhen, kdes 116 s−1 (red), or 1 mm DTT, kdes 131 s−1 (cyan). D, Activation and desensitization of the G725C mutant in reducing conditions, kdes 280 s−1 (blue) had similar kinetics to wild-type, but when the patch was bathed in oxidizing conditions a rapid but reversible loss of current was observed; upon recovery in DTT, kdes 250 s−1 (cyan), responses were generally smaller than control. E, Similar redox sensitivity was observed for the S729C mutant, control kdes 298 s−1 (blue), but full recovery occurred on return to DTT, kdes 304 s−1 (cyan). F, Bar plot of desensitization rates in response to 10 mm glutamate in reducing conditions (1 mm DTT); values are mean ± SEM of 5 – 9 observations per construct.
Figure 2.
Figure 2.
The GluR2 I664C mutant shows partial inactivation under oxidizing conditions. A, Responses to 10 mm glutamate recorded in oxidizing and reducing conditions; the peak current was reduced fourfold in CuPhen but the rate of decay was similar to control conditions: control kdes 210 s–1 (blue), CuPhen kdes 220 s–1 (red); upon return to DTT, the peak amplitude was restored and the decay was faster, kdes 300 s–1 (cyan). B, Bar plot showing the increase in peak current amplitude upon switching from CuPhen to 1 mm DTT for wild-type GluR2 and the three Cys mutants; values are mean ± SEM of 5 observations per construct.
Figure 3.
Figure 3.
Concentration dependence and kinetics of desensitization for wild-type GluR2 and the S729C mutant. A, Paired pulses of 10 mm glutamate in the presence of 1 mm DTT were applied to the S729C mutant to measure the kinetics of recovery from desensitization; the inter pulse interval for the 11 responses shown ranged from 10 ms to 2 s; the upper trace is the piezo stimulus protocol. B, Kinetics of recovery from desensitization for wild-type GluR2 in normal conditions and in 1 mm DTT, and for the S729C mutant in 1 mm DTT; the solid lines show Hodgkin-Huxley type fits (see Materials and Methods) C, The trace shows 11 superimposed responses to10 mm glutamate for wild-type GluR2, preceded by 10 μm prepulses of duration 6 ms to 2.5 s; the upper trace is the piezo command, showing the resting level, the prepulse, and the final step to the 10 mm test pulse. D, The same protocol as in C for the S729C mutant; desensitization is faster and the steady-state desensitization by 10 μm glutamate more profound that for wild-type. E, The amplitude of responses for wild-type GluR2 following prepulses (3 – 200 μm glutamate) plotted on a log time scale; data points show mean ± SEM for 5–7 patches fit with a mono-exponential function to estimate kdes; the rates and extent of desensitization at steady state were: 3 μm, 7 s−1, 9 ± 1%; 10 μm, 18 s−1, 31 ± 2%; 50 μm, 30 s−1, 63 ± 2%; and 200 μm, 52 s−1, 94.6 ± 0.3%. F, The same analysis for the S729C mutant (n = 5); the rates and extent of desensitization at steady state were: 3 μm, 18 s−1, 38 ± 2%; 10 μm, 30 s−1, 65 ± 2%; 50 μm, 70 s−1, 86 ± 2%; and 200 μm, 100 s−1, 92 ± 1%. G, Concentration response analysis for equilibrium desensitization of wild-type GluR2 and the S729C mutant; wild-type receptors are half-maximally desensitized by 22 ± 1 μm glutamate (n = 5–7 per point); the desensitization of the S729C mutant shows a stronger sensitivity to glutamate, with half-maximal extent of desensitization at 5.8 ± 0.4 μm glutamate. H, Concentration dependence of the rate of onset of desensitization measured as in C and D; the rates were fitted with a binding isotherm raised to a fractional power (see Materials and Methods, slope factors were 0.11 ± 0.04 for wild-type receptors and 0.10 ± 0.02 for the S729C mutant); the shallowness of the concentration dependence, and the lack of precision in estimates of the entry rate at low concentrations precluded accurate determination of the half-maximal rate.
Figure 4.
Figure 4.
Disulfide trapping of the S729C mutant. A, Test responses to 10 mm glutamate are inhibited following a 3.2 s exposure to 50 μm glutamate and 10 μm CuPhen (*); the response to the first application of 10 mm glutamate after trapping is too small to measure, but in the continuous presence of DTT full recovery occurs at a rate of 0.3 s−1, as shown by a single exponential fit to the envelope of the peak amplitude of subsequent responses to glutamate (filled red circles); extrapolation to the end of the application of 50 μm glutamate and 10 μm CuPhen (open red circle) was used to estimate the extent of trapping; the upper trace shows the piezo command voltage. B, The 1st and 22nd responses to 10 mm glutamate in DTT from panel A are essentially indistinguishable, as shown in the inset for which the traces are overlaid. These traces were chosen because of their similar amplitude, and in both, desensitization was well described by a single exponential function (red curves, kdes = 332 s–1). The upper trace is the open tip response recorded at the end of the experiment. C, Trapping in the absence of ligand is much slower than in the presence of glutamate. Exposure to 10 μm CuPhen for 12.8 s (*) traps 54% of receptors. The peak currents during recovery in DTT were fitted as in panel A (red curve, 0.3 s–1) and the trapping estimated from the fitted curve (open circle). D, The active fraction of receptors in the presence of 50 μm glutamate (filled circles), or at rest (open circles), was plotted against the period of trapping in 10 μm CuPhen; with 50 μm glutamate there was complete trapping; in contrast, for receptors at rest trapping remained incomplete at 360 s. The arrows represent the time intervals for the representative traces shown in B and C. For trapping in resting conditions, the solid line is a biexponential fit (τ1 = 3.5 ± 0.6 s (amplitude 76 ± 5%), τ2 = 50 ± 20 s; active fraction at t = 32 ± 2%); the dashed line shows a monoexponential fit (τ = 7 ± 1 s).
Figure 5.
Figure 5.
Disulfide trapping of the S729C mutant in the presence of CNQX or kainate. A, Coapplication of 30 μm CNQX slowed the onset of, and reduced the extent of trapping by 10 μm CuPhen; the first response following the end of the antagonist application was reduced in amplitude because CNQX remained bound during the rise of the current evoked by the test application of 10 mm glutamate. B, Trapping in the presence of a saturating concentration of the weak partial agonist kainate also slowed the onset, and reduced the extent of trapping by 10 μm CuPhen, but to a lesser extent than CNQX; the first response following the end of the partial agonist application was reduced in amplitude because kainate remained bound during the rise of the current evoked by the test application of 10 mm glutamate. C, Data summarizing trapping in the presence of 1 mm kainate (n = 6) and 30 μm CNQX (n = 4–10 patches per data point), compared with trapping at rest and in the presence of 50 μm glutamate (dashed lines); the arrow indicates the trapping interval for the representative examples shown in A and B. The rate of trapping of the S729C mutant in the presence of kainate (0.06 ± 0.01 s–1) is slower than for receptors at rest, even though kainate causes weak desensitization (supplemental Fig. 2, available at www.jneurosci.org as supplemental material); trapping by CNQX is slower still (0.03 ± 0.01 s–1); note also the inverse correlation between rate and extent of trapping.
Figure 6.
Figure 6.
The GluR2 L483Y mutant strongly reduces trapping. A, In the presence of 1 mm DTT, the L483Y-S729C double mutant does not desensitize in response to a 25 ms application of 10 mm glutamate. B, In response to a 500 ms application of glutamate the extent (9 ± 1%) and rate of desensitization (kdes = 4.5 ± 1.5 s–1, n = 3 patches) for the L483Y-S729C double mutant are similar those previously found for the L483Y single mutant (data from Sun et al., 2002). C, At rest the L483Y-S729C double mutant shows no detectable trapping following an 80 s exposure to 10 μm CuPhen, although as shown below with much longer applications weak trapping was observed. D, In contrast the L483Y-S729C double mutant can be efficiently trapped by application of 300 μm glutamate at a rate of 0.13 ± 0.03 s–1, n = 5 patches, estimated from the fit of a single exponential (white dashed line). E, Rate and extent of trapping by glutamate in oxidizing conditions was concentration dependent. The dashed line shows the faster trapping of the single S729C mutant in glutamate. We detected trapping when the receptor was exposed to oxidizing conditions for long intervals (>100 s) in the absence of any ligand, and this was apparently abolished, at least on the timescale of our measurements, when domain 2 was restrained by binding of CNQX (30 μm).
Figure 7.
Figure 7.
The relationship between the rate and extent of trapping suggests that the S729C mutant disulfide bond has a limited lifetime. A, Bar plot summarizing the rate of trapping for the S729C and L483Y-S729C mutants in different conditions. Trapping is fastest in the presence of 50 μm glutamate. The L483Y mutant slows trapping, and in the presence of CNQX trapping was eliminated; the bar for LY-SC CNQX is an upper estimate of the trapping rate given that we observed no trapping after 360 s. B, Bar plot summarizing the extent of trapping in the steady state for the same conditions as in A. C, The proportion of receptors that were not trapped in steady-state conditions showed a strong negative correlation to the trapping rate. These data were reasonably well described by a simple isotherm where the lifetime of the disulfide trapped conformation was 25 s. The LY-SC CNQX point (open circle) was not included in the fit. Although two disulfide bonds presumably form in a fully trapped tetrameric receptor, we do not know the activity of a singly trapped receptor, and so we did not include this complexity in our fitting.
Figure 8.
Figure 8.
Disulfide bond breakage in oxidizing conditions. A, Average of 5 responses of the S729C mutant to 10 mm glutamate in reducing conditions (1 mm DTT); inset shows single exponential fit (red), kdes 287 s–1. B, In the same patch, a time-dependent relief of trapping occurred in the continuous presence of CuPhen. Four separate traces are overlaid with 1, 3, 16 and 36 s exposures to CuPhen at rest, following the application of 50 μm glutamate; DTT was present only during the test pulses of 10 mm Glu indicated by *. Relief from trapping in DTT is slow enough (0.3 s–1) that there is negligible change in the rise time and peak amplitude of the test pulse. The inset shows the final pulse, after 36 s of exposure to CuPhen at rest; single exponential fit (red) to the current during the 20 ms application of 10 mm Glu (red), kdes = 337 s–1. C, The relaxation of the trapped receptors at rest in CuPhen, normalized to the mean of prerelaxation and postrelaxation responses in DTT, was fitted with a monoexponential recovery with a lifetime of 13 ± 6 s (data from 5 patches). The steady-state level of nontrapped receptors was 21 ± 4%, similar to the level of trapped receptors at rest without pretrapping in glutamate (32 ± 2%, Fig. 4).
Figure 9.
Figure 9.
Diagram showing pathways for formation of D2 cross-links in AMPA receptors. One dimer of the two dimers in the receptor complex is depicted, with a cylinder representing the membrane-associated ion channel domain. The extracellular ligand binding clamshell domains have two lobes (D1, blue and D2, magenta). At rest, the ion channel is closed (red cylinder). The closure of the clamshell following the binding of glutamate (yellow) opens the channel (green); subsequent desensitization leads to disulfide bond cross-linking of the lower lobes (D2) between the introduced cysteine residues (orange bars). From the resting state two further conformational changes also lead to spontaneous D2 cross-linking. The first is dissociation of the active D1 dimer interface (top). The second is spontaneous hyperextension of the lower lobe of the ligand binding domain (left).

References

    1. Ahmed AH, Thompson MD, Fenwick MK, Romero B, Loh AP, Jane DE, Sondermann H, Oswald RE. Mechanisms of antagonism of the GluR2 AMPA receptor: structure and dynamics of the complex of two willardiine antagonists with the glutamate binding domain. Biochemistry. 2009;48:3894–3903. - PMC - PubMed
    1. Armstrong N, Gouaux E. Mechanisms for activation and antagonism of an AMPA-sensitive glutamate receptor: Crystal structures of the GluR2 ligand binding core. Neuron. 2000;28:165–181. - PubMed
    1. Armstrong N, Sun Y, Chen GQ, Gouaux E. Structure of a glutamate-receptor ligand-binding core in complex with kainate. Nature. 1998;395:913–917. - PubMed
    1. Armstrong N, Mayer M, Gouaux E. Tuning activation of the AMPA-sensitive GluR2 ion channel by genetic adjustment of agonist-induced conformational changes. Proc Natl Acad Sci U S A. 2003;100:5736–5741. - PMC - PubMed
    1. Armstrong N, Jasti J, Beich-Frandsen M, Gouaux E. Measurement of conformational changes accompanying desensitization in an ionotropic glutamate receptor. Cell. 2006;127:85–97. - PubMed

Publication types

MeSH terms

Substances

LinkOut - more resources