. 2009 Sep 23;29(38):12000-8.
doi: 10.1523/JNEUROSCI.1651-09.2009.

A chimera analysis of prestin knock-out mice

Affiliations

A chimera analysis of prestin knock-out mice

Mary Ann Cheatham et al. J Neurosci. .

Abstract

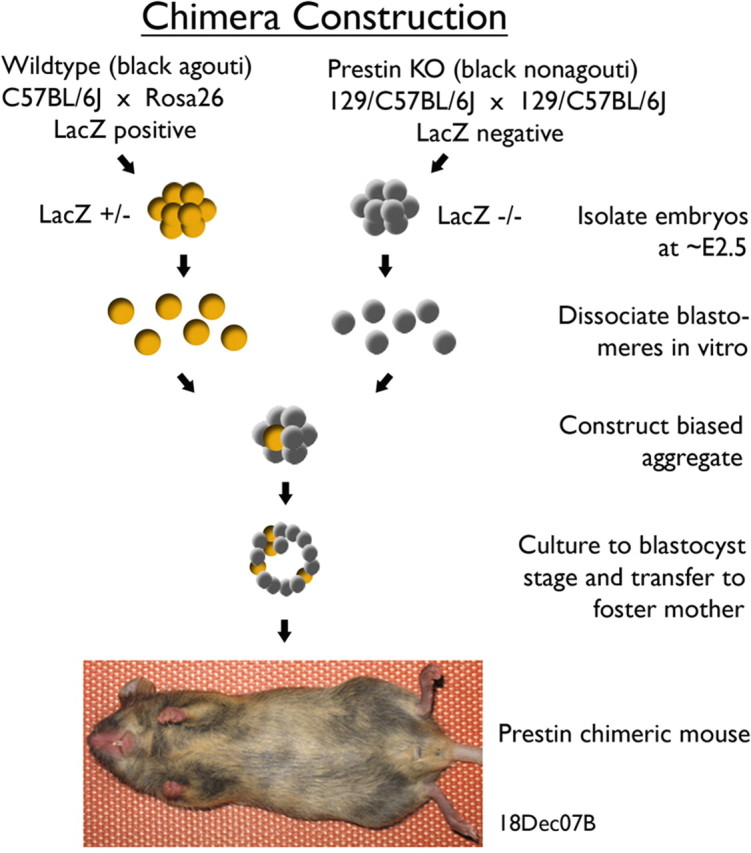
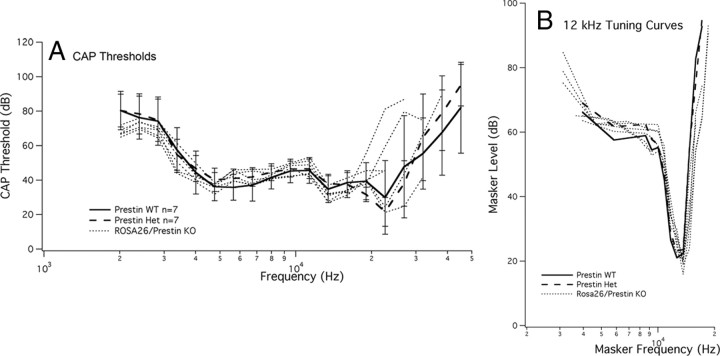
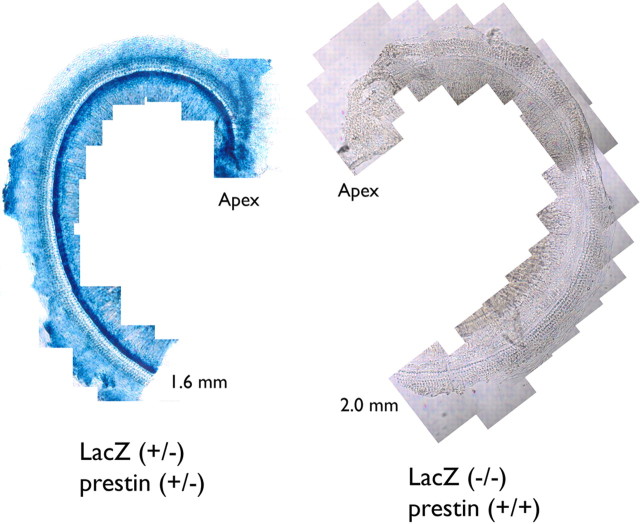
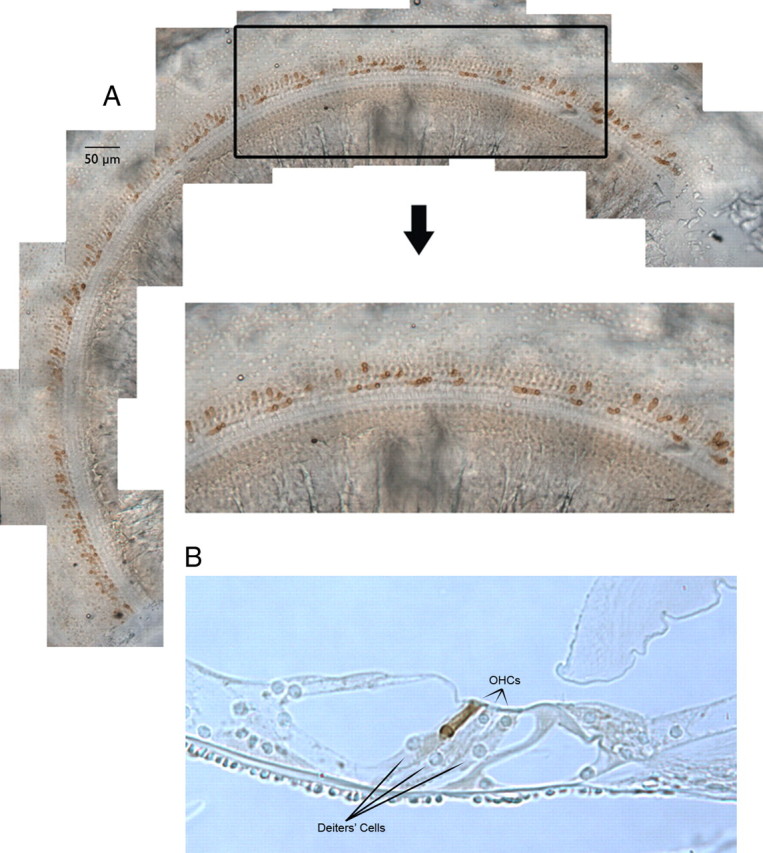
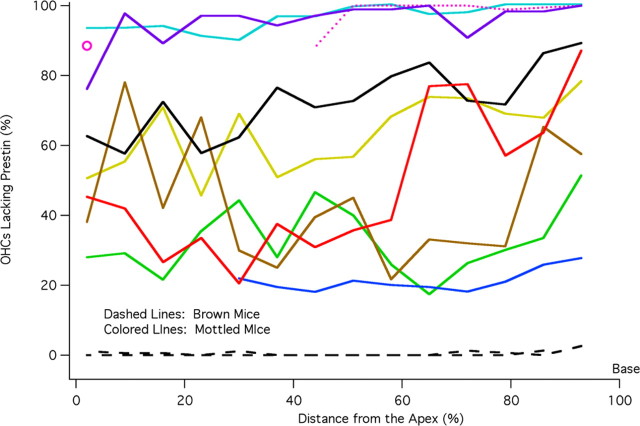
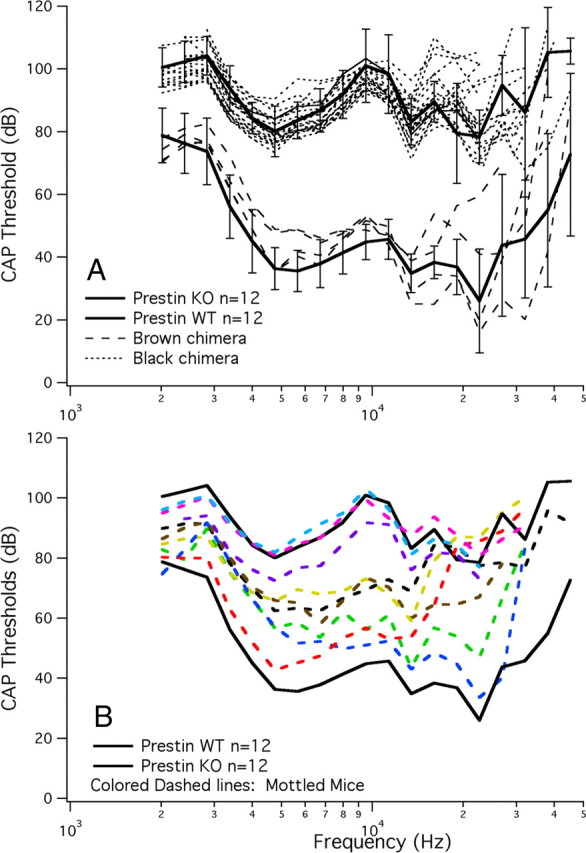
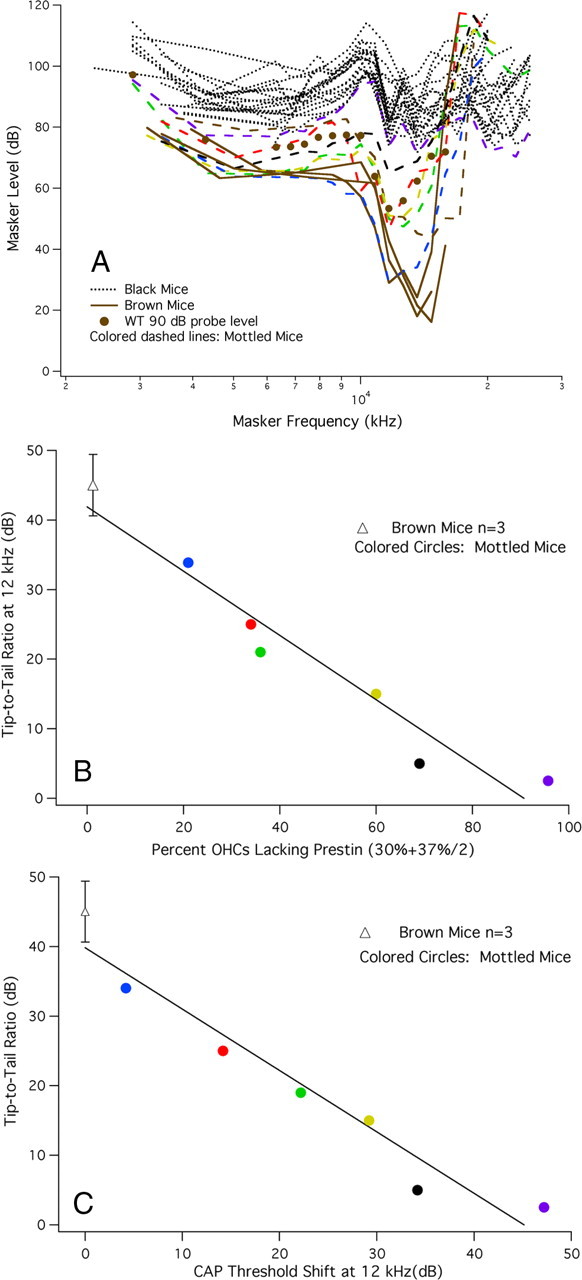
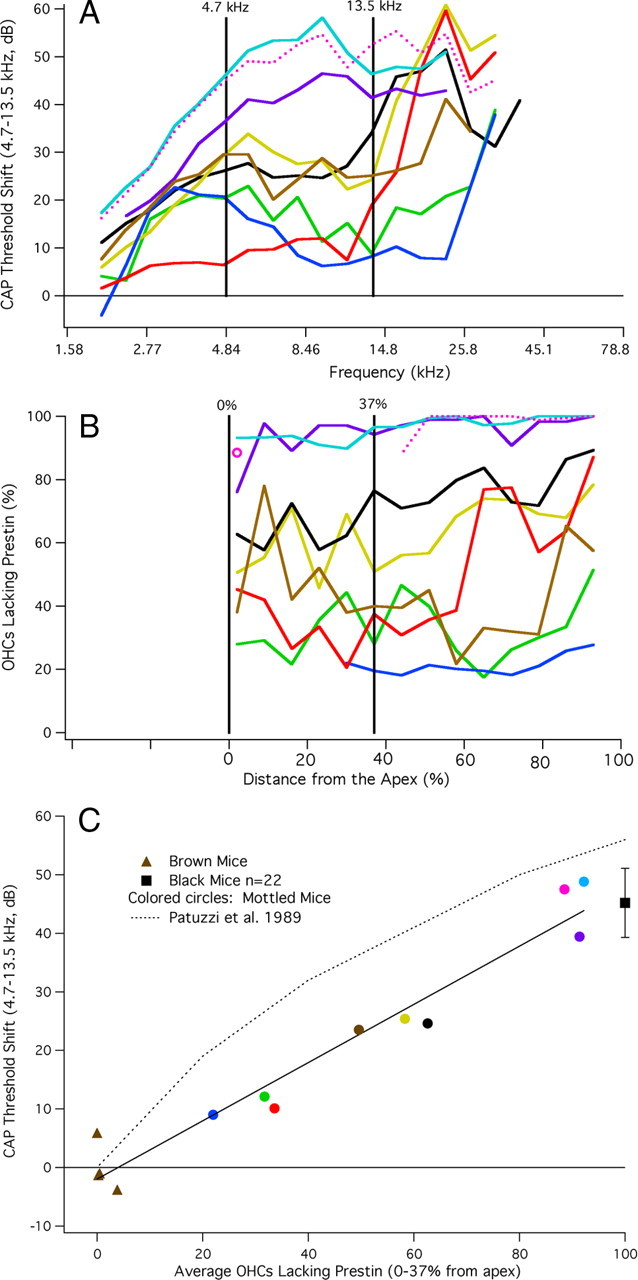
A chimera is a genetic composite containing a unique mix of cells derived from more than one zygote. This mouse model allows one to learn how cells of contrasting genotype functionally interact in vivo. Here, we investigate the effect that different proportions of prestin-containing outer hair cells (OHC) have on cochlear amplification. To address this issue, we developed a prestin chimeric mouse in which both ROSA26 wild-type (WT) and prestin knock-out (KO) genotypes are present in a single cochlea. The WT ROSA26 mice express a cell marker, allowing one to identify cells originating from the WT genome. Examination of cochlear tissue indicated that prestin chimeric mice demonstrate a mosaic in which mutant and normal OHCs interleave along the cochlear partition, similar to all other chimeric mouse models. The anatomical distribution of prestin-containing OHCs was compared with physiological data including thresholds and tuning curves for the compound action potential (CAP) recorded in anesthetized mice. Analysis of these measures did not reveal mixed phenotypes in which the distribution of prestin-containing OHCs impacted sensitivity and frequency selectivity to different degrees. However, by reducing the number of prestin-containing OHCs, phenotypes intermediate between WT and KO response patterns were obtained. Accordingly, we demonstrate a proportional reduction in sensitivity and in the tip length of CAP tuning curves as the number of OHCs derived from the KO genome increases; i.e., genotype ratio and phenotype are closely related.


Figures

Figure 1.
Figure 1.
Construction of prestin chimeras. Parental strains with contrasting coat color were used to form two embryo groups differing in the expression of prestin and lacZ genes. After fusion of contrasting embryos, a chimeric blastocyst is transferred to a pseudopregnant female. Prestin chimeric mice are easily distinguished in any given litter by their variegated coat color.
Figure 2.
Figure 2.
Peripheral auditory physiology is normal in ROSA26/prestin heterozygous mice. A, B, Offspring obtained by mating a ROSA26 homozygote with a prestin KO mouse show normal CAP thresholds in A and CAP tuning curves in B. WT data are plotted with solid lines, prestin heterozygotes with dashed lines, and ROSA26/prestin heterozygotes with dotted lines.
Figure 3.
Figure 3.
LacZ staining in the organ of Corti. An apical coil is stained with the chromogenic substrate X-Gal in a ROSA26-positive mouse on the left and a negative control shown on the right at 25×. These mice were obtained by breeding a ROSA26 homozygote with a prestin KO mouse.
Figure 4.
Figure 4.
A, Distribution of prestin-containing OHCs in a chimeric cochlea. A segment of stitched segments lying 2.8 and 4.3 mm from the base is enlarged to reveal the mosaic pattern of OHCs derived from ROSA26 WT and prestin KO embryos. Only OHCs from the ROSA26-positive parent stain with anti-prestin. B, A representative radial section of the organ of Corti in a chimeric mouse is provided in B for illustrative purposes. This 5 μm section was obtained from a mid-cochlear segment (∼3 mm from the helicotrema) at 20× to show increase in Deiters'-cell lengths associated with short, no prestin-containing OHCs. This particular chimera had 39% OHCs staining for prestin. The two shorter than normal OHCs were derived from the prestin KO parent; the longer OHC in row 3, from the ROSA26 WT parent.
Figure 5.
Figure 5.
Cochleograms. The percentage of OHCs lacking prestin is plotted as a function of distance from the apex of the cochlea. The average number of unstained/missing cells is computed for each 7% segment. Cochleograms for brown mice are plotted with dashed lines. Data for mottled mice are represented with solid, colored lines except for the one mouse plotted with pink dotted lines to indicate that data are missing in the apex. Although the data plotted represent the average percentage of OHCs lacking prestin for all rows, it should be stated that there was only one instance where a statistically significant difference existed between rows of OHCs. This occurred in one mottled mouse and for only the most basal 7% section. The color code used for mottled mice is maintained in Figures 7B, 8, and 9.
Figure 6.
Figure 6.
Asymmetry in chimeric ears. The absolute difference between right and left ears is plotted in percent for chimeric mice. The mean difference and SD are also appended and plotted with solid lines.
Figure 7.
Figure 7.
CAP thresholds for chimeric mice. A, Mice of a single coat color appeared as WT when brown (dashed lines) or KO (dotted lines) when black. For comparison, mean and SDs for WT and prestin KO mice are appended. CAP thresholds in mottled mice are provided in B. Animals with a variegated coat color (colored dashed lines) exhibited an intermediate phenotype that spanned the range between WT and KO sensitivities. The more brown in coat color the more WT in phenotype.
Figure 8.
Figure 8.
A, CAP tuning curves at 12 kHz in chimeric mice. Similar to the changes in threshold, CAP tuning curves at 12 kHz were WT like in brown mice (solid lines) and KO like in black mice (dotted lines). Mottled mice (colored dashed lines) exhibited a decreasing tip-to-tail ratio as the number of OHCs containing prestin decreased. The average probe level for brown mice was 54 dB, for black mice, 93 dB and for mottled mice 74 dB. B, For brown and mottled mice, the tip-to-tail ratio is plotted as a function of the percentage of OHCs lacking prestin. This latter metric is computed over a distance located between 30 and 44% of the distance from the apex. Brown mice (open triangle) are represented by their mean and SD, while data for mottled, chimeric mice are plotted individually as colored circles. C, In this panel, tip-to-tail ratio is plotted as a function of CAP threshold shift at 12 kHz for brown mice, represented by their mean and SD, and for mottled mice plotted individually. It should be understood that a full dataset was not collected on each mouse. This related to shipping difficulties such that some mice arrived when they were much older than is ideal for making round-window recordings. In addition, some mice displayed anatomical anomalies that prevented CAP recording and in other instances tissue was lost in the region coding for the 12 kHz probe. Hence, our inability to provide results for a larger number of mottled mice.
Figure 9.
Figure 9.
A, B, CAP threshold shifts (A) and cochleograms (B). By using the mouse frequency/place map of Müller et al. (2005), the physiological and anatomical data were plotted on the same abscissa to correlate changes in prestin expression with changes in sensitivity. It should be noted, however, that CAP responses below ∼4.5 kHz are produced by single units with characteristic frequencies greater than the stimulus frequency. In other words, these nerve fibers are responding on the tails of their tuning curves. Average threshold shift and average percentage of OHCs lacking prestin are computed for frequencies and distances indicated by the vertical lines. The cochleogram plotted with the pink dotted line indicates missing tissue due to dissection artifact. In this case, basal counts are available, as well as for the last apical segment, which appears as an isolated open circle. The CAP threshold shift for this mouse is also plotted with a dotted line. The relationship between CAP threshold shift and percentage OHCs lacking prestin is provided in C. In this figure, the average CAP threshold shift for frequencies between 4.7 and 13.5 kHz is plotted as a function of the percentage of OHCs lacking prestin. It should also be stated that the same result was obtained when the average CAP threshold was extended to 16.5 kHz. However, we decided to use the narrower range because CAP threshold shifts increase rapidly >13.5 kHz in some mottled mice; i.e., the threshold shift did not remain flat. Data for brown mice appear as triangles, those for mottled mice as colored circles. The mean (±one SD) for black mice appears as a square. The predicted change of gain estimated by Patuzzi et al. (1989, their Fig. 3) is appended for reference.
Figure 10.
Figure 10.
A Thèvenin equivalent circuit showing displacement sources for both somatic (xo) and ciliary (yo) motility. Component factors are identified in the Discussion.

References

    1. Bohne BA, Harding GW. Processing and analyzing the mouse temporal bone to identify gross, cellular and subcellular pathology. Hear Res. 1997;109:34–45. - PubMed
    1. Brown SD, Hardisty-Hughes RE, Mburu P. Quiet as a mouse: dissecting the molecular and genetic basis of hearing. Nat Rev Genet. 2008;9:277–290. - PubMed
    1. Cheatham MA, Huynh KH, Gao J, Zuo J, Dallos P. Cochlear function in Prestin knockout mice. J Physiol. 2004;560:821–830. - PMC - PubMed
    1. Cheatham MA, Zheng J, Huynh KH, Du GG, Gao J, Zuo J, Navarrete E, Dallos P. Cochlear function in mice with only one copy of the Prestin gene. J Physiol. 2005;569:229–241. - PMC - PubMed
    1. Cheatham MA, Zheng J, Huynh KH, Du GG, Edge RM, Anderson CT, Zuo J, Ryan AF, Dallos P. Evaluation of an independent prestin mouse model derived from the 129S1 strain. Audiol Neurootol. 2007;12:378–390. - PubMed

Publication types

Substances