. 2009 Oct 28;131(42):15358-74.
doi: 10.1021/ja9058958.

Mechanism of amido-thiourea catalyzed enantioselective imine hydrocyanation: transition state stabilization via multiple non-covalent interactions

Affiliations

Mechanism of amido-thiourea catalyzed enantioselective imine hydrocyanation: transition state stabilization via multiple non-covalent interactions

Stephan J Zuend et al. J Am Chem Soc. .

Abstract

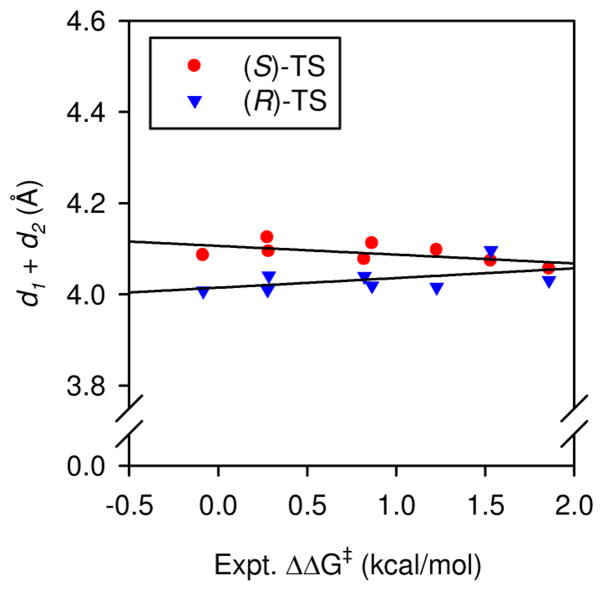
An experimental and computational investigation of amido-thiourea promoted imine hydrocyanation has revealed a new and unexpected mechanism of catalysis. Rather than direct activation of the imine by the thiourea, as had been proposed previously in related systems, the data are consistent with a mechanism involving catalyst-promoted proton transfer from hydrogen isocyanide to imine to generate diastereomeric iminium/cyanide ion pairs that are bound to catalyst through multiple noncovalent interactions; these ion pairs collapse to form the enantiomeric alpha-aminonitrile products. This mechanistic proposal is supported by the observation of a statistically significant correlation between experimental and calculated enantioselectivities induced by eight different catalysts (P << 0.01). The computed models reveal a basis for enantioselectivity that involves multiple stabilizing and destabilizing interactions between substrate and catalyst, including thiourea-cyanide and amide-iminium interactions.


Figures

Figure 1
Figure 1
Dual H-bonding interaction between imine and thiourea. The three-dimensional structure is a local minimum at the B3LYP/6-31G(d,p) level of theory.
Figure 2
Figure 2
Rate dependence on [HCN] and [imine]. Plot of rate of imine hydrocyanation catalyzed by 4a ([cat]tot = 0.0040 M) versus [imine] at different [HCN]i. Each set of points represents the average rate determined from two individual kinetics experiments with [imine]i = 0.20 M (red points) or [imine]i = 0.10 M (blue points). The black curves represent least-squares fits of the experimental rate versus conversion data to eq 1.
Figure 3
Figure 3
Rate dependence on [cat]tot and [imine]. Plot of rate of imine hydrocyanation ([HCN]i = 0.25 M) catalyzed by 4a versus [imine] at different [cat]tot. Each set of points represents the average rate determined from two individual kinetics experiments with [imine]i = 0.20 M. The black curves represent least-squares fits of the experimental rate versus concentration data to eq 1.
Figure 4
Figure 4
Rate dependence of imine hydrocyanation catalyzed by 4a or 4b on substrate electronic properties. Plot of the logarithm of pseudo-first-order rate constant (log(kobsd)) versus σp for the hydrocyanation of p-substituted imines 2b–2g ([2]i = 0.040 M) by TMSCN/MeOH (0.50 M) mediated by thiourea catalyst 4a ([cat]tot = 0.0020 M, ■) or urea catalyst 4b ([cat]tot = 0.0020 M, ▲) versus σp. The black curves represent least-squares fits to f(x) = a + ρ x, athiourea = −2.74 ± 0.06, ρthiourea = −2.7 ± 0.2; aurea = −3.25 ± 0.08, ρurea = −2.5 ± 0.2.
Figure 5
Figure 5
Rate dependence of imine hydrocyanation on substrate electronic properties. Logarithm of pseudo-first order rate constant (log(kobsd)) versus σp of the hydrocyanation of p-substituted imines 2g–2l ([2]i = 0.040 M) mediated by TMSCN/MeOH (0.50 M) and thiourea catalyst 5 (0.0050 M). The black curve depicts an unweighted least-squares fit to f(x) = a + ρ x (ρ = −3.3 ± 0.1). The experiments leading to Figures 4 and 5 were executed under identical conditions, except that the concentration of 5 was 2.5-fold greater than of 4a or 4b.
Figure 6
Figure 6
Partial 1H-NMR spectra of reactions depicted in eq 3 after 25 min using (A) DCN, catalyst 6b, and imine 2h, (B) HCN, catalyst 6b, and imine 2h, or (C) DCN and catalyst 6b. Data were collected at 32 °C. Under these conditions, the catalyst exists as a 5:1 mixture of amide rotamers. Deuterium incorporation at the N-H position of the α-aminonitrile can be assessed by analyzing the coupling pattern of the C(CN)H proton (δ 4.3 ppm). The experiment containing DCN displays quantitative deuterium incorporation into the α-aminonitrile, whereas the experiment containing HCN displays quantitative proton incorporation into the α-aminonitrile. HCN and DCN were generated from TMSCN and MeOH or MeOD. The enantiomeric excess of the α-aminonitrile isolated from these reactions is 84–85%.
Figure 7
Figure 7
Calculated transition structures for HCN-addition to imine 9a catalyzed by 8a (B3LYP/6-31G(d)). Transition structures leading to (A) (R)-α-aminonitrile and (B) (S)-α-aminonitrile are shown.
Figure 8
Figure 8
Calculated transition structures for HNC-addition to imine 9a catalyzed by 8a (B3LYP/6-31G(d)). Transition structures leading to (A) (R)-α-aminonitrile and (B) (S)-α-aminonitrile are shown.
Figure 9
Figure 9
Amido-thioureas used in quantitative computational analysis.
Figure 10
Figure 10
Calculated versus experimental enantioselectivity of HNC addition to 2a at the B3LYP/6-31G(d) level. Plot of calculated ΔΔE of HNC-addition transition structures versus estimated experimental ΔΔG (Table 2, entries 1, 4–10). The curve represents a least-squares fit to f(x) = a + bx, a = 0.1 ± 0.2 kcal/mol, b = 1.2 ± 0.2, R2 = 0.87, Pb = 0.0006.
Figure 11
Figure 11
Calculated versus experimental enantioselectivity of HNC addition to 2a at the M05-2X/6-31+G(d,p)//B3LYP/6-31G(d) level. Plot of calculated ΔΔE of HNC-addition transition structures versus estimated experimental ΔΔG (Table 2, entries 1, 4–10). The curve represents a least-squares fit to f(x) = a + bx, a = −0.5 ± 0.4 kcal/mol, b = 1.9 ± 0.4, R2 = 0.79, Pb = 0.0033.
Figure 12
Figure 12
Calculated versus experimental enantioselectivity of HNC addition to 2a at the MP2/6-31G(d)//B3LYP/6-31G(d) level. Plot of calculated ΔΔE of HNC-addition transition structures versus estimated experimental ΔΔG (Table 2, entries 1, 4–10). The curve represents a least-squares fit to f(x) = a + bx, a = −1.1 ± 0.4 kcal/mol, b = 2.6 ± 0.4, R2 = 0.91, Pb = 0.0003.
Figure 13
Figure 13
Calculated transition structures for HNC addition to imine 2a catalyzed by 6a. Transition structures leading to the (A) major and (B) minor enantiomer are shown.
Figure 14
Figure 14
Calculated transition structures for HNC-addition to imine 2a catalyzed by 6f. Transition structures leading to the (A) minor and (B) major enantiomer are shown.
Figure 15
Figure 15
H-bond distances between thiourea (X = S) or urea (X = O) and cyanide anion.
Figure 16
Figure 16
Correlation of transition structure bond length with enantioselectivity for HNC addition to imine 2a. Plot of the sum of the cyanide–(thio)urea H-bond lengths in B3LYP/6-31G(d) transition structures using catalysts 6a–6h versus experimental energy difference between (R)- and (S)-transition states estimated using catalysts 4a–4h (Table 2). The black curves represent a least-squares fit to f(x) = a + b x; (R)-TS: a = 4.01 ± 0.02 Å, b = 0.02 ± 0.02 Å mol kcal−1, R2 = 0.24, Pb = 0.22; (S)-TS: a = 4.11 ± 0.01 Å, b = −0.01 Å mol kcal−1, R2 = 0.34, Pb = 0.13.
Figure 17
Figure 17
Qualitative reaction coordinate diagram for iminium/cyanide ion pair rearrangement depicting H-bond distances between iminium ion, cyanide anion, and catalyst amide.
Figure 18
Figure 18
Correlation of transition structure bond length with enantioselectivity for HNC addition to imine 2a. Plot of the sum of the cyanide N–iminium H + amide O–iminium H bond lengths in B3LYP/6-31G(d) transition structures using catalysts 6a–6h versus experimental energy difference between (R)- and (S)-transition structures using catalysts 4a–4h (Table 2.2). The black curves represent a least-squares fit to f(x) = a + b x; (R)-TS: a = 4.527 ± 0.01 Å, b = 0.039 ± 0.009 Å mol kcal−1, R2 = 0.75, Pb = 0.0054; (S)-TS: a = 4.59 ± 0.04 Å, b = 0.25 ± 0.04 Å mol kcal−1, R2 = 0.88, Pb = 0.0005.
Scheme 1
Scheme 1
Enantioselective imine hydrocyanation catalyzed by chiral (thio)urea derivatives
Scheme 2
Scheme 2
Examples of proposed anion-binding mechanisms promoted by chiral (thio)urea derivatives involving (A) N-acyl iminium/chloride and (B) oxocarbenium/chloride ion pairs
Scheme 3
Scheme 3
Competing enantioselectivity-determining pathways in the amino-thiourea catalyzed cyanosilylation of ketones (ref 16c). Mechanism A is favored, but both pathways are energetically accessible.
Scheme 4
Scheme 4. Proposed transition structures for (A) water-mediateda and (B) chiral Lewis-acid catalyzedb imine hydrocyanation
a. ref . b. ref
Scheme 5
Scheme 5
Limiting mechanisms for imine hydrocyanation proceeding through (A) an iminium ion or (B) an α-amidonitrile anion.
Scheme 6
Scheme 6. Amido-(thio)urea controlled HNC addition to iminea
a. Bond distances (Å) for X = S are shown. All energies are relative to the energy calculated for 10a or the analogous urea-derived complex.
Scheme 7
Scheme 7
Catalyst-controlled, HCN-mediated imine hydrocyanation.
Scheme 8
Scheme 8
Catalyst-controlled, HNC-mediated imine hydrocyanation.
Scheme 9
Scheme 9
Catalyst-controlled, HNC-mediated imine hydrocyanation

References

    1. Review, historical perspective, and leading references: Doyle AG, Jacobsen EN. Chem Rev. 2007;107:5713–5743.

    1. For classic examples, see: Johnson JS, Evans DA. Acc Chem Res. 2000;33:325–335.

    1. Trost BM, Machacek MR, Aponick A. Acc Chem Res. 2006;39:747–760. - PubMed
    1. Recent reviews: Lelais G, MacMillan DWC. Aldrichimica Acta. 2006;39:79–87.Mukherjee S, Yang JW, Hoffmann S, List B. Chem Rev. 2007;107:5471–5569.

    1. For a detailed discussion, see: Israelachvili J. Intermolecular & Surface Forces. 2. Academic Press; London: 1991. pp. 109–121.The strength of repulsive non-bonding interactions is roughly proportional to (1/r)12. Within this model, a 25% increase in r leads to a 93% decrease in interaction energy

Publication types