. 2009;10(9):R101.
doi: 10.1186/gb-2009-10-9-r101. Epub 2009 Sep 24.

High resolution transcriptome maps for wild-type and nonsense-mediated decay-defective Caenorhabditis elegans

Affiliations

High resolution transcriptome maps for wild-type and nonsense-mediated decay-defective Caenorhabditis elegans

Arun K Ramani et al. Genome Biol. 2009.

Abstract

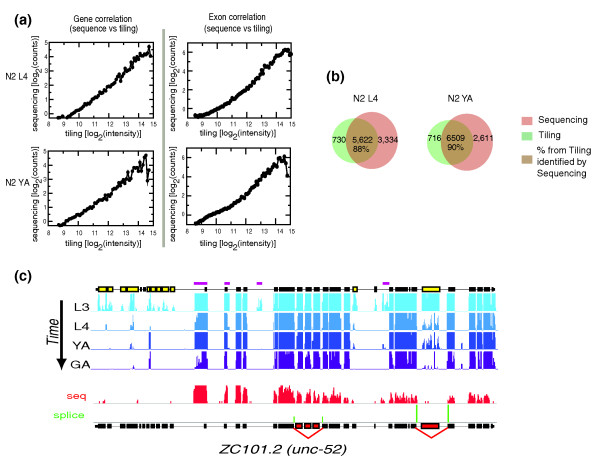
Background: While many genome sequences are complete, transcriptomes are less well characterized. We used both genome-scale tiling arrays and massively parallel sequencing to map the Caenorhabditis elegans transcriptome across development. We utilized this framework to identify transcriptome changes in animals lacking the nonsense-mediated decay (NMD) pathway.

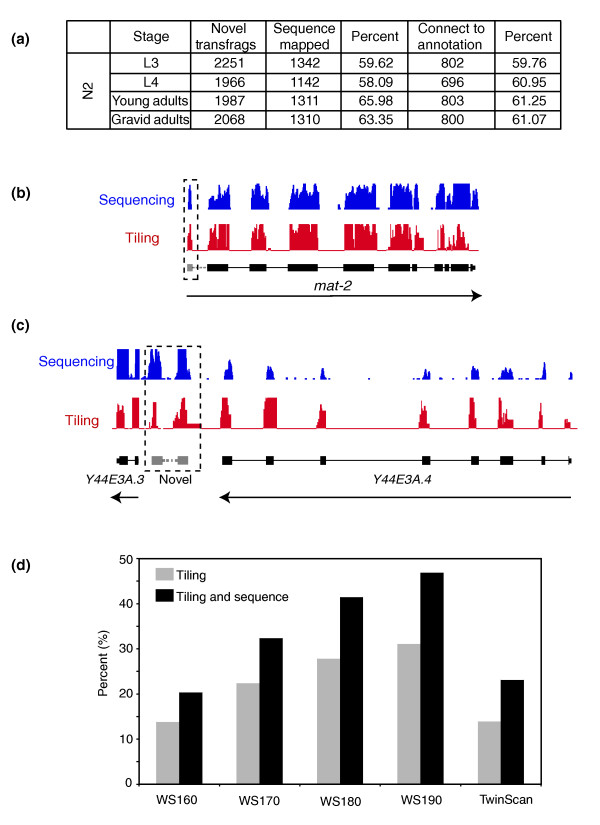
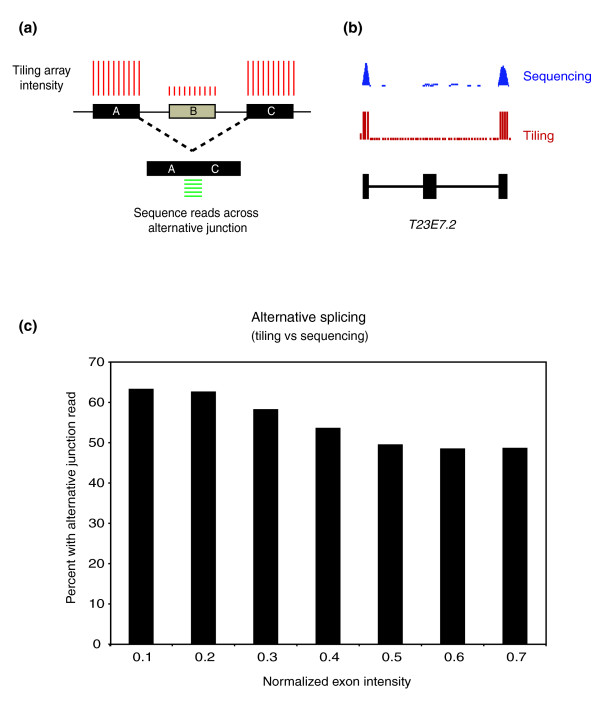
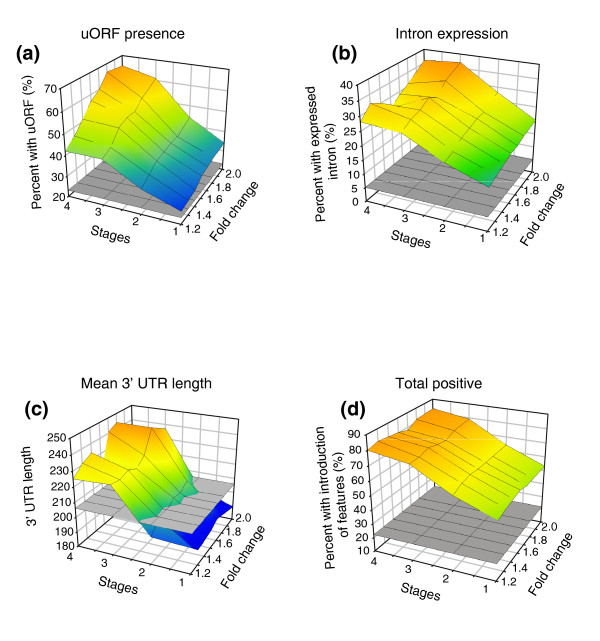
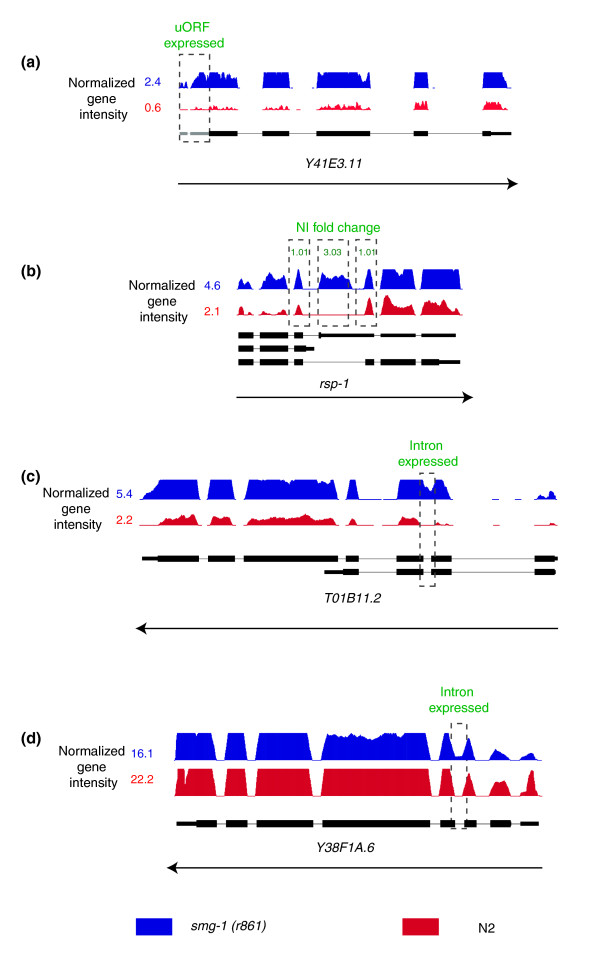
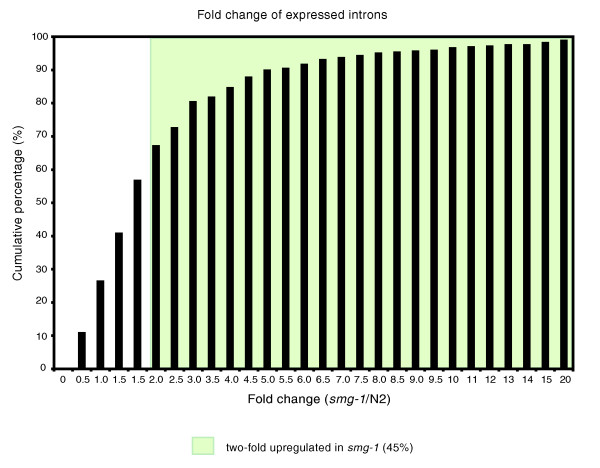
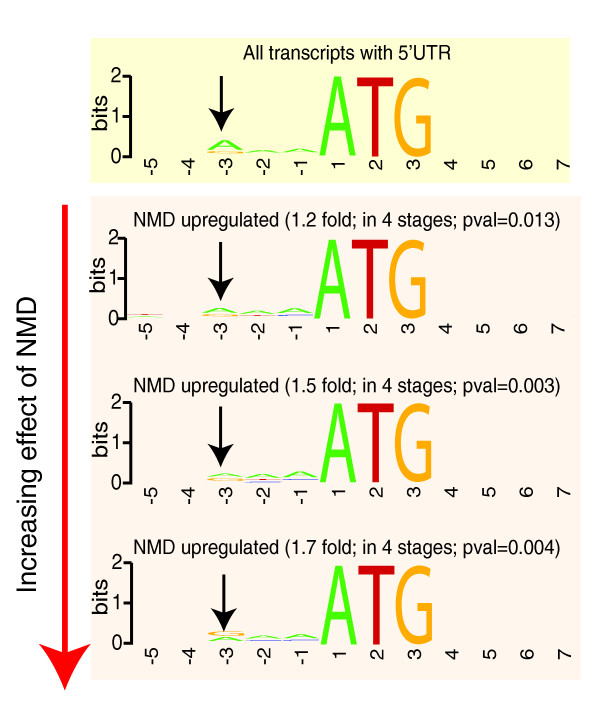
Results: We find that while the majority of detectable transcripts map to known gene structures, >5% of transcribed regions fall outside current gene annotations. We show that >40% of these are novel exons. Using both technologies to assess isoform complexity, we estimate that >17% of genes change isoform across development. Next we examined how the transcriptome is perturbed in animals lacking NMD. NMD prevents expression of truncated proteins by degrading transcripts containing premature termination codons. We find that approximately 20% of genes produce transcripts that appear to be NMD targets. While most of these arise from splicing errors, NMD targets are enriched for transcripts containing open reading frames upstream of the predicted translational start (uORFs). We identify a relationship between the Kozak consensus surrounding the true start codon and the degree to which uORF-containing transcripts are targeted by NMD and speculate that translational efficiency may be coupled to transcript turnover via the NMD pathway for some transcripts.

Conclusions: We generated a high-resolution transcriptome map for C. elegans and used it to identify endogenous targets of NMD. We find that these transcripts arise principally through splicing errors, strengthening the prevailing view that splicing and NMD are highly interlinked processes.


Figures

Figure 1
Figure 1
Tiling array data and sequence-based data give similar views of the transcriptome. (a) Gene intensities (left) and exon intensities (right) from the tiling data were binned at 0.1 increments of gene intensity (log2 scale) and compared with the intensities deriving from sequence data; there is a strong correlation (R2 = 0.95) between gene intensities derived from both technologies. YA, young adult.(b) Approximately 90% of the genes expressed based on tiling are also expressed in the sequence data in both stages sequenced. (c) Sample screenshot from Affymetrix Integrated Genome Browser illustrating how tiling array data and sequence data correspond to predicted gene structures. Tiling array data from four developmental stages (L3 and L4 larvae, YA and gravid adults (GA)) are shown in shades of blue. The predicted exons of unc-52 (ZC101.2) are shown at the top of the plot. Exons that are differentially spliced across development based on tiling data are shown in yellow. Regions corresponding to transfrags that do not overlap predicted exon structures are highlighted with purple bars. Sequence data for a single developmental stage (YA) is shown in red at the bottom of the figure; note that the regions identified as transcribed by sequencing correspond closely to those identified by tiling. Non-adjacent exon boundaries spanned by sequence reads are shown as green bars and the exons removed by the alternative splice shown in red below; the height of the green bar corresponds to the frequency with which the alternative splice events were detected.
Figure 2
Figure 2
Novel transfrag annotation. (a) Using stage specific sequence data we were able to show that approximately 60% of the novel transfrags have sequenced reads mapping to them. We also show that 60% of these transfrags with sequence information can be connected to known gene annotation using paired-ended sequence reads, where one read of the pair is anchored on the transfrag while the other overlaps a gene annotation. Examples of novel regions identified from our analysis, show (b) a new 5' exon and (c) a novel transcript. (d) Transfrags identified as novel in our tiling data based on WS150 of the genome annotation were compared against WS160, WS170, WS180 and WS190 models. We see that >30% of the transfrags that were novel based on WS150 are predicted to be exonic in later annotations (grey bars). Almost 50% of novel transfrags that also have sequence reads overlapping them are predicted to be exonic in later annotations (black bars). We can show annotation overlap for a further 15% (tiling alone - gray) or 25% (tiling with sequence data - black) when we compare the transfrags to TwinScan models.
Figure 3
Figure 3
Splicing changes. Normalized exon intensities (see Materials and methods) were calculated for all exons. (a) The set of cassette exons was determined using our tiling data as exons with an NI <0.8 (exon B). Cassette exons may also be indicated by the presence of sequence reads spanning the boundaries of the flanking exons (exons A and C). (b) An example of a typical cassette exon. (c) Exons were binned based on their NI (x-axis) and the percentage of these cassette exons that have sequence reads spanning the exonA-exonC junction were identified. At a NI <0.2 nearly 65% of the cassette events show an alternative exon read while 50% of all exons with NI <0.5 can be shown to have an alternative junction spanning read.
Figure 4
Figure 4
Features predisposing transcripts to NMD. Indicated are the percentage of genes exhibiting the measured feature (y-axis), the number of stages at which this is observed (x-axis) and the fold increase in gene intensity in smg-1(r861) over N2 (z-axis, log2 scale). In each case the average background occurrence of the feature is indicated by the grey square. The measured features are: (a) percentage of genes with a uORF; (b) percentage of genes with expressed introns; (c) average 3' UTR length; (d) the total percentage occurrence of the above three NMD features for the set of over-expressed genes. The plots show a clear positive correlation between the feature examined and the increased effect of NMD on the transcripts.
Figure 5
Figure 5
Examples of NMD features. (a) Example of a gene upregulated in smg-1(r861) and showing transcript expression from the upstream ORF. (b) Exon4 of rsp-1 is alternatively spliced in smg-1(r861) animals, observed as a change in the NI of the exon between the two stages. (c) The retention of an intron expressed at very high levels in the mutant, which also has a higher gene intensity. (d) A retained intron, where the gene intensity remains similar between the mutant and wild type (that is, a gene for which only a small proportion of transcripts retain the intron).
Figure 6
Figure 6
Intron expression is upregulated in NMD mutants. Of the introns expressed in both N2 and smg-1(r861), 1,642 (45%) introns are ≥2-fold upregulated in smg-1(r861). Nearly 75% of the expressed introns have higher expression (>1 in the x-axis) in smg-1(r861) compared to wild type.
Figure 7
Figure 7
Relationship between consensus Kozak sequence at the true start ATG for genes affected by NMD compared with all genes. In each panel the x-axis corresponds to the sequence considered while the y-axis refers to the percent occurrence at each nucleotide position expressed as 'bits' using Weblogo [70]. The top panel (in yellow) shows the consensus among all transcripts with an annotated 5' UTR and reveals the importance of an adenine in the -3 position - this is the classic Kozak consensus. This occurrence of adenine at the -3 position decreases significantly with increased NMD regulation as is shown in the bottom panel (red). The significance of change in enrichment of the adenine at -3 between NMD regulated and all genes was determined by chi-squared test. Pval, P-value.

Similar articles

Cited by

References

    1. Gaudet J, Muttumu S, Horner M, Mango SE. Whole-genome analysis of temporal gene expression during foregut development. PLoS Biol. 2004;2:e352. doi: 10.1371/journal.pbio.0020352. - DOI - PMC - PubMed
    1. Friedman N. Inferring cellular networks using probabilistic graphical models. Science. 2004;303:799–805. doi: 10.1126/science.1094068. - DOI - PubMed
    1. Segal E, Shapira M, Regev A, Pe'er D, Botstein D, Koller D, Friedman N. Module networks: identifying regulatory modules and their condition-specific regulators from gene expression data. Nat Genet. 2003;34:166–176. doi: 10.1038/ng1165. - DOI - PubMed
    1. Ben-Tabou de-Leon S, Davidson EH. Gene regulation: gene control network in development. Annu Rev Biophys Biomol Struct. 2007;36:191. doi: 10.1146/annurev.biophys.35.040405.102002. - DOI - PubMed
    1. Howard ML, Davidson EH. cis-Regulatory control circuits in development. Dev Biol. 2004;271:109–118. doi: 10.1016/j.ydbio.2004.03.031. - DOI - PubMed

LinkOut - more resources