

Review
doi: 10.1016/j.neuron.2009.09.009.
Cortical enlightenment: are attentional gamma oscillations driven by ING or PING?
Affiliations
- PMID: 19778503
- PMCID: PMC2778762
- DOI: 10.1016/j.neuron.2009.09.009
Item in Clipboard
Review
Cortical enlightenment: are attentional gamma oscillations driven by ING or PING?
Neuron.
.
Abstract
The response of a neuron to sensory stimuli can only give correlational support for functional hypotheses. To experimentally test causal function, the neural activity needs to be manipulated in a cell-type-specific as well as spatially and temporally precise way. We review recent optogenetic experiments on parvalbumin-positive cortical interneurons that link modeling studies of synchronization to experimental studies on attentional modulation of gamma oscillations in primates.
Figures
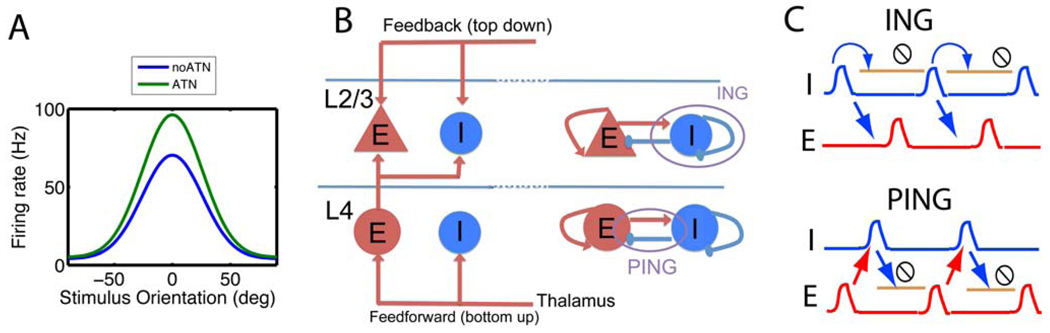
(A) The response of neurons in intermediate visual cortical areas reflects the interaction of multiple factors, one of which is the stimulus. We show the orientation tuning curve (firing rate as a function of the stimulus orientation) when attention is directed outside (blue -No ATN) and into the receptive field (green -- ATN). The green curve can be mathematically described as the blue curve multiplied by a gain factor (exaggerated for clarity) that is independent of the firing rate and stimulus orientation. (B, left) Simplified representation of the laminar structure of the feedforward pathway in V1. The feedforward (FF, bottom-up) pathway projects to the E and I cells in layer 4 (L4), which in turn sends an excitatory projection to L2/3 cells. The L2/3 cells also receive feedback (FB, top down) inputs from other cortical areas (such as V2). (B, right) In both layers there are reciprocally connected networks of E and I cells (‘PING’) as well as mutually connected I cells (‘ING’). The I cells and their projections are shown in blue, whereas the E cells and their projections are shown in red. For clarity, we omitted some of the inhibitory projections. (C) The synchronous network activity underlying response modulation can be generated in two different ways. For the ING mechanism, the I cells are sufficiently excited to spike in the absence of excitatory network activity. Synchrony arises because cells ready to spike shortly after the first volley will be stopped by the resulting inhibition until they can participate in the next volley. The I cells in turn synchronize the E cells. The period is determined by the recovery of the I cells, which reciprocally inhibit themselves. In the PING mechanism, a synchronous excitatory volley is necessary to elicit a synchronous volley from the I cells. The period is thus determined by the time for recovery of the E cells from the inhibition. The schematic blue and red histograms show the spike time density of the inhibitory (I) and excitatory (E) neurons, respectively. The light brown lines with the stop sign indicate the period during which the network is inactive due to the high value of the inhibitory conductance.
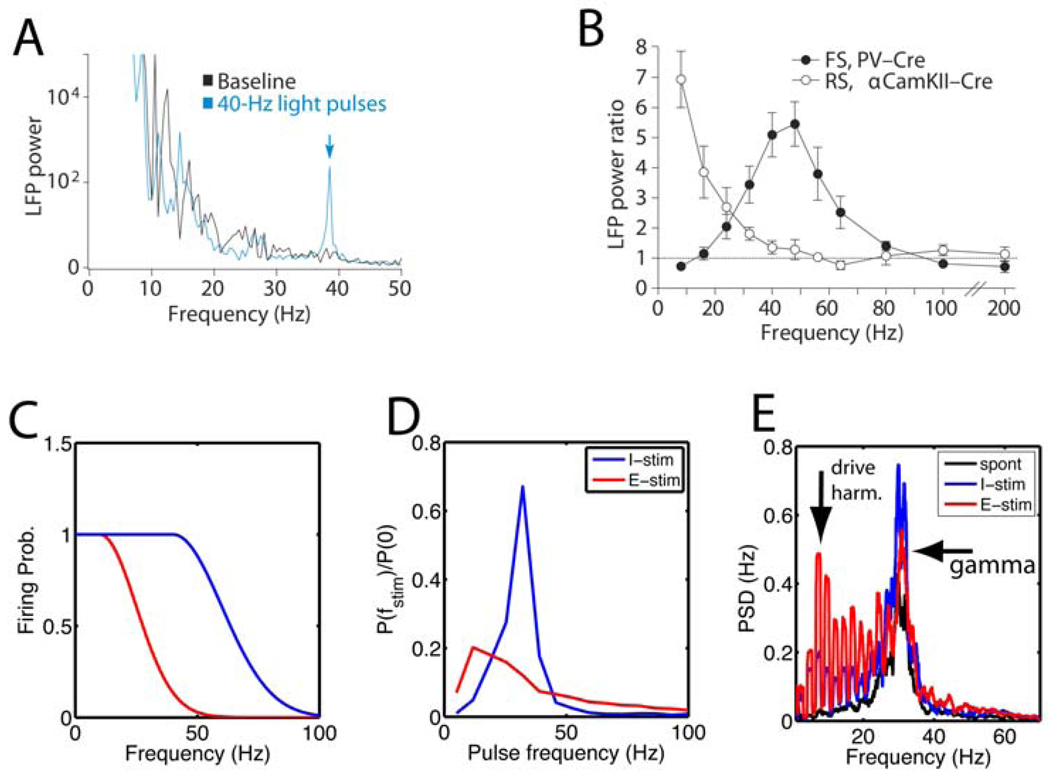
(A,B) Results of in vivo experiments using periodic light pulse trains to activate cells via ChR2 channels expressed in either parvalbumin-positive cells or pyramidal cells, taken with permission from (Cardin et al., 2009). (A) The power spectrum of the recorded LFP (black line) during the baseline condition without light stimulation and (blue line) during stimulation with a 40 Hz light pulse train. The power spectrum characteristically decays as a function of frequency, but the blue curve has a peak at the stimulation frequency (indicated by the arrow). (B) The power at the stimulation frequency normalized by the power in the baseline condition is plotted as a function of stimulation frequency for light activation of (filled circles) FS cells and (open circles) RS cells, here referred to as E and I cells, respectively. There was a peak at gamma frequencies for the I cell stimulation, indicating a resonance, which was absent for E-cell stimulation. (C) The effectiveness of above threshold periodic stimulation depends on cell class because of the duration of the refractory period and other adaptation effects (Fellous et al., 2001). These data are schematically summarized by plotting the spike probability per light pulse as a function of pulse frequency. The E cell (red) firing probability drops off at lower pulse frequencies compared with the I cells (blue). This shows that the amount of spiking activity induced in the cortical circuit for a given frequency depends on the cell type that is targeted. (D–E) Results obtained from a computer model from (Buia and Tiesinga, 2006) of a reciprocally connected network of I and E cells capable of producing gamma oscillations using the PING mechanism (see Supplementary Information). (D) The network was stimulated by periodic conductance pulse trains to either the I cells (blue) or the E cells (red) and the fraction of power at the stimulated frequency is shown relative to the power at zero frequency. Stimulating the I cells led to more power at the harmonic of the drive frequency, which peaked in the gamma frequency range, whereas stimulating E cells led to less power, which peaked at a lower frequency near 12 Hz. Compare with the experimental results in (B). (E) A more critical test of the ability of the network to generate (transient) gamma oscillations is obtained by applying one pulse and determining whether and for how long there is an increase in power in the gamma frequency range. This was quantified using the power spectral density (PSD) of the E-cell spike time histograms (related to the LFP), where the highest peak at gamma frequencies is obtained in response to stimulation of I cells (blue, ‘I-stim’), less power by stimulating the E cells (red, ‘E-stim’), with the lowest power obtained when there is no stimulation (black, ‘spont’). The light pulses were presented at an average interval of about 400ms, corresponding to a frequency of 2.5 Hz. Hence, there are peaks at harmonics of the stimulation frequency which are strongest when the E cells are directly stimulated.
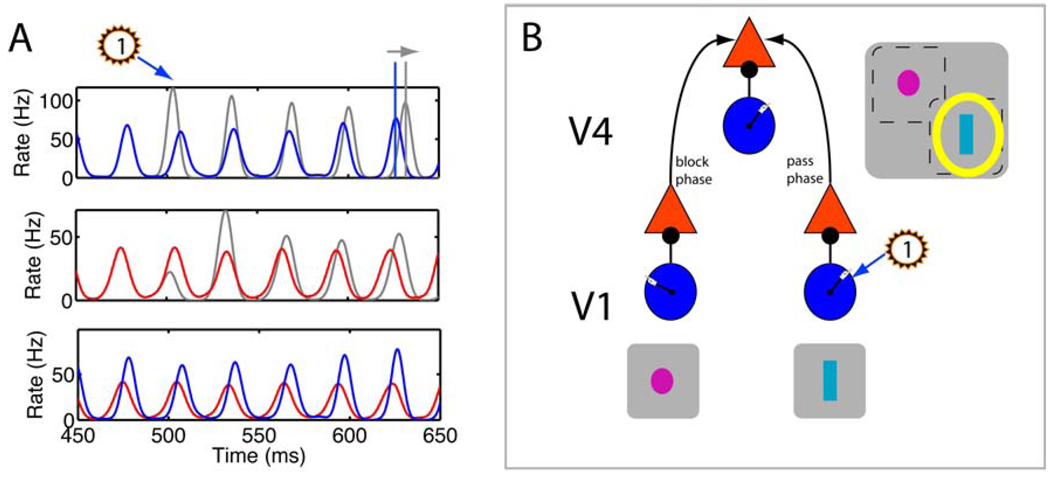
In models of the E-I circuit (Buia and Tiesinga, 2006), a pulse to the I cells changed the global phase of the oscillations (see Supplementary Information). (A) The spike time histograms show: (bottom) the unperturbed oscillation, with I- and E-cell activity in blue and red, respectively; (middle) the E-cell activity (gray) was perturbed by a pulse to the I cells at 500ms (flashed “1”) and, for comparison, is shown together with the reference curve from the unperturbed oscillations in red; and (top) the perturbed I-cell activity with the reference curve. The pulse made the inhibitory volley appear earlier, and (middle) cut short the excitatory volley that was building up. After a 100 ms transient, the perturbed oscillation is delayed with respect to the reference (horizontal arrow), showing that an overall phase change occurred. (B) The schematic model V4 cell had a large RF that contained the two non-overlapping RFs of presynaptic neurons, for instance in V1. Each neuron was part of a local circuit (shown as an E cell, red triangle, receiving input from an I cell, blue circle), which when synchronized has a global phase as indicated by the hand of the clock in the blue circle. According to the CTC hypothesis, by altering the relative phase between V1 and V4 neurons (‘pass phase’, indicated by the arrow), the effectiveness of stimulus 1 (cyan bar) in driving the V4 neuron can be increased (yellow halo). Thus the CTC hypothesis can be tested in experiments where phase changes elicited by light pulses can be manipulated and linked to perception.
Similar articles
-
Reconciling coherent oscillation with modulation of irregular spiking activity in selective attention: gamma-range synchronization between sensory and executive cortical areas.J Neurosci. 2010 Feb 24;30(8):2856-70. doi: 10.1523/JNEUROSCI.4222-09.2010. J Neurosci. 2010. PMID: 20181583 Free PMC article.
-
Neural synchrony and the development of cortical networks.Trends Cogn Sci. 2010 Feb;14(2):72-80. doi: 10.1016/j.tics.2009.12.002. Epub 2010 Jan 14. Trends Cogn Sci. 2010. PMID: 20080054 Review.
-
Analysis of synchronization between two modules of pulse neural networks with excitatory and inhibitory connections.Neural Comput. 2006 May;18(5):1111-31. doi: 10.1162/089976606776241039. Neural Comput. 2006. PMID: 16595059
-
Downregulation of parvalbumin at cortical GABA synapses reduces network gamma oscillatory activity.J Neurosci. 2011 Dec 7;31(49):18137-48. doi: 10.1523/JNEUROSCI.3041-11.2011. J Neurosci. 2011. PMID: 22159125 Free PMC article.
-
Cellular mechanisms of neuronal population oscillations in the hippocampus in vitro.Annu Rev Neurosci. 2004;27:247-78. doi: 10.1146/annurev.neuro.27.070203.144303. Annu Rev Neurosci. 2004. PMID: 15217333 Review.
Cited by
-
Spike Pattern Structure Influences Synaptic Efficacy Variability under STDP and Synaptic Homeostasis. II: Spike Shuffling Methods on LIF Networks.Front Comput Neurosci. 2016 Aug 9;10:83. doi: 10.3389/fncom.2016.00083. eCollection 2016. Front Comput Neurosci. 2016. PMID: 27555816 Free PMC article.
-
Gamma-Rhythmic Gain Modulation.Neuron. 2016 Oct 5;92(1):240-251. doi: 10.1016/j.neuron.2016.09.003. Epub 2016 Sep 22. Neuron. 2016. PMID: 27667008 Free PMC article.
-
Distribution and intrinsic membrane properties of basal forebrain GABAergic and parvalbumin neurons in the mouse.J Comp Neurol. 2013 Apr 15;521(6):1225-50. doi: 10.1002/cne.23290. J Comp Neurol. 2013. PMID: 23254904 Free PMC article.
-
Spontaneous variability in gamma dynamics described by a damped harmonic oscillator driven by noise.Nat Commun. 2022 Apr 19;13(1):2019. doi: 10.1038/s41467-022-29674-x. Nat Commun. 2022. PMID: 35440540 Free PMC article.
-
Comprehensive characterization of oscillatory signatures in a model circuit with PV- and SOM-expressing interneurons.Biol Cybern. 2021 Oct;115(5):487-517. doi: 10.1007/s00422-021-00894-6. Epub 2021 Oct 9. Biol Cybern. 2021. PMID: 34628539 Free PMC article.
References
-
- Allman J, Miezin F, McGuiness E. Stimulus-specific responses from beyond the classical receptive field: neurophysiological mechanisms for local-global comparisons on visual neurons. Annu Rev Neurosci. 1985;8:407–430. - PubMed
-
- Bartos M, Vida I, Jonas P. Synaptic mechanisms of synchronized gamma oscillations in inhibitory interneuron networks. Nat Rev Neurosci. 2007;8:45–56. - PubMed
-
- Bernander O, Koch C, Usher M. The Effect of Synchronized Inputs at the Single Neuron Level. Neural Computation. 1994;6:622–641.
Publication types
MeSH terms
Grants and funding
LinkOut - more resources
Full Text Sources
