. 2009 Sep 24;63(6):803-17.
doi: 10.1016/j.neuron.2009.05.029.

Characterization of small RNAs in Aplysia reveals a role for miR-124 in constraining synaptic plasticity through CREB

Affiliations

Characterization of small RNAs in Aplysia reveals a role for miR-124 in constraining synaptic plasticity through CREB

Priyamvada Rajasethupathy et al. Neuron. .

Abstract

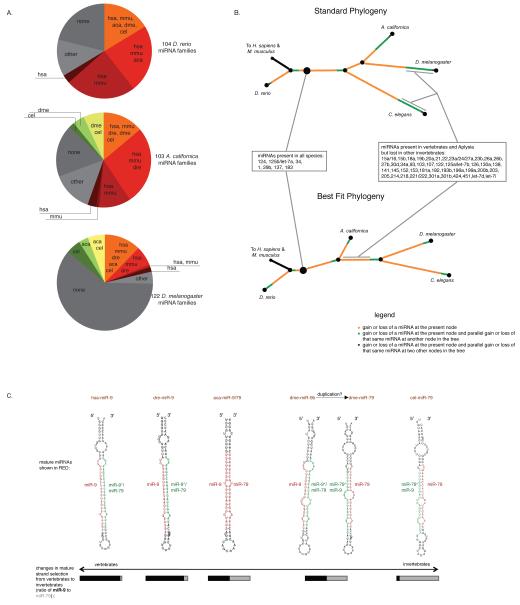
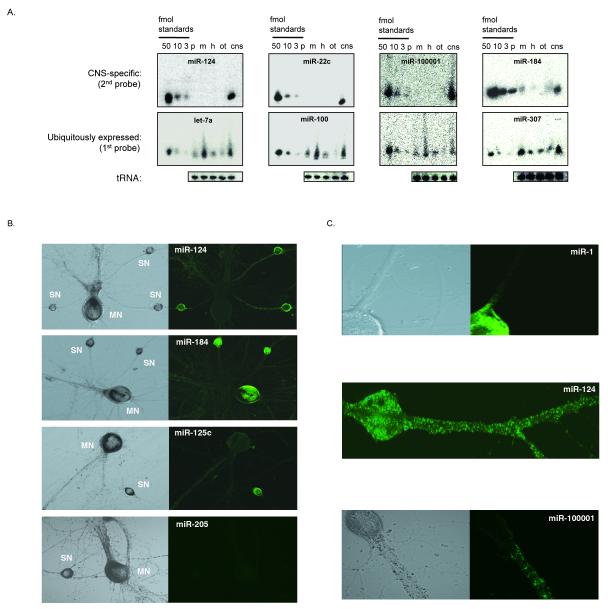
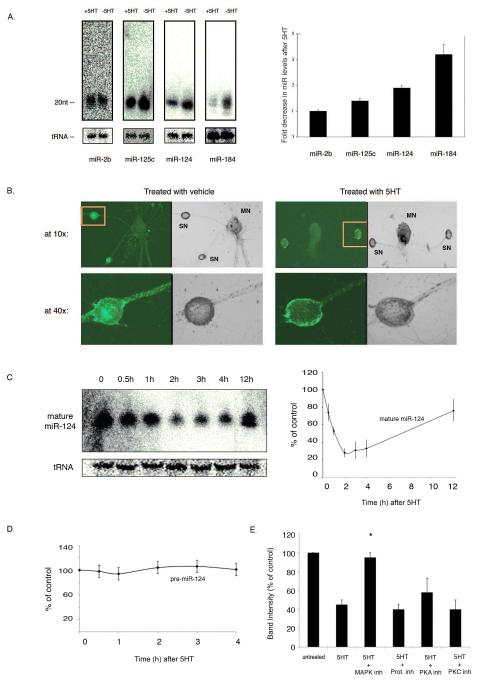
Memory storage and memory-related synaptic plasticity rely on precise spatiotemporal regulation of gene expression. To explore the role of small regulatory RNAs in learning-related synaptic plasticity, we carried out massive parallel sequencing to profile the small RNAs of Aplysia californica. We identified 170 distinct miRNAs, 13 of which were novel and specific to Aplysia. Nine miRNAs were brain enriched, and several of these were rapidly downregulated by transient exposure to serotonin, a modulatory neurotransmitter released during learning. Further characterization of the brain-enriched miRNAs revealed that miR-124, the most abundant and well-conserved brain-specific miRNA, was exclusively present presynaptically in a sensory-motor synapse where it constrains serotonin-induced synaptic facilitation through regulation of the transcriptional factor CREB. We therefore present direct evidence that a modulatory neurotransmitter important for learning can regulate the levels of small RNAs and present a role for miR-124 in long-term plasticity of synapses in the mature nervous system.


Figures

Figure 1
Figure 1. Aplysia miRNAs are more similar to those of vertebrates than invertebrates
A. Pie charts illustrating the fraction of miRNA families in a given species that bear homology relationships with miRNA families in other species. Homology with vertebrates are displayed in shades of red, invertebrates in yellow and green. Absence of conservation, or mixed conservation patterns (other) are displayed in shades of gray. B. The evolutionary relationship of the miRNAs in 5 species, as understood through gain and loss events, is mapped onto both a standard phylogeny (based on rRNA distances) and an alternate phylogeny (based on best fit of our data). In both cases, Aplysia is closer to the vertebrates than is D. melanogaster or C. elegans. The alternate tree, however, is able to minimize the number of parallel and independent evolutionary events (green and red beads) that must occur to satisfy the phylogenetic architecture. We highlight the 8 miRNAs that are present in all represented species, and the 46 miRNAs that were preserved from vertebrates to Aplysia, but subsequently lost in other invertebrates. C. miR-9 and miR-79, although thought to be distinct miRNAs emerging from separate loci, are in fact star sequences of each other. Here we show that miR-9 is preferentially expressed in vertebrates, while miR-79 is preferentially expressed in invertebrates. Aplysia, however, expresses both in equal proportions in 3-p/5-p fashion.
Figure 2
Figure 2. The abundant miRNAs observed in A. californica CNS
The top 95% of miRNA clone content from the CNS library is shown, along with enrichment in the brain as compared to the whole animal, distribution in abdominal and pleural ganglia, the existence or absence of a precursor in the genome together with cloning evidence for its star sequence, and finally homology relationships to H. sapiens (H), M. musculus (M), D. rerio (Z), D. melanogaster (D), and C. elegans (C).
Figure 3
Figure 3. Characterization of miRNA tissue and cell specificity and sub-cellular distribution
A. Northern blots showing the expression of 8 different mature miRNAs across various tissues including (p) hepatopancreas, (m) muscle, (h) heart, (ot) ovotestis, and (cns) central nervous system. 20 μg of total RNA were loaded in each lane (except in the case of miR-100001, where 40 μg of total RNA was loaded due to difficulty detecting signal). Detection of synthetic miRNAs loaded on the far left of the blots at a concentration of 50 fmol, 10 fmol, and 3 fmol serve as positive controls. tRNA bands are shown to control for equal loading of samples. B. Projection images of 10x confocally acquired images from 1 μm slices through a sensory (SN) –motor (MN) co-culture in situ hybridized with DNA probes complementary to the mature miRNA sequence. As a negative control, some cells were probed for mir-205, which is not expressed in Aplysia neurons, and therefore show no staining. miR-124 and miR-125c are exclusively found in the sensory neuron (SN). C. Projection images of 40x confocally acquired images showing an example of a miRNA that is primarily found in the cell body (miR-1), primarily in the cell process (miR-100001), and in both compartments (miR-124).
Figure 4
Figure 4. miRNAs are rapidly down-regulated by serotonin
A. Northern blot showing mature miRNA levels in untreated CNS (-5HT) and CNS treated with five spaced pulses of serotonin (+5HT). Blots were re-probed for tRNA to monitor equal loading of samples. Changes in miRNA levels are quantified and presented as a mean of 6 independent trails ± S.D. B. In situ hybridization experiments in sensory-motor co-cultures show that exposure to 5 pulses of 5HT causes a significant reduction of miR-124 levels in sensory neurons. C. Northern blot showing mature miRNA levels in CNS in control cells (0) and in CNS at 30 minutes (0.5 h), 1, 2, 3, 4, and 12 hours after treatment with 5HT. The blots are re-probed for tRNA to control for equal loading of samples. The data are quantified in the right panel and presented as a mean of 4 independent trials ± S.D. D. Real time PCR data showing miR-124 precursor levels at 0, 0.5, 1, 2, and 4 hours after treatment with 5 pulses of 5HT. Data are shown as a mean of 6 independent trials ± S.D. E. CNS were treated with 10 μM, in L-15, of each of the indicated inhibitors for 30 minutes prior to treatment with 5 pulses of 5HT. Following 1.5 hours after washout from 5HT and the inhibitors, total RNA was extracted, northern blotted, and probed for miR-124. Levels of miR-124 are given as mean band intensity from Northern blots and the data are presented here as a mean of 4 independent trials ± S.D.
Figure 5
Figure 5. miR-124 negatively constrains serotonin-dependent long-term hetero-synaptic facilitation
A. Phase contrast micrograph of the experimental model used for the electrophysiological experiments. An Aplysia L7 motorneuron (MN) is contacted by two sensory neurons (SN1 and SN2). B. Representative current-clamp electrophysiological recordings of EPSPs in motor neurons after extracellular stimulation of the sensory neuron. For each individual sensorimotor synapse, EPSPs were recorded before as well as 24 and 48 hrs after 5 x 5HT treatment. C. Phase contrast (left column) and fluorescent micrographs (right columns) of in situ hybridized miR-124 levels in cultured sensory neurons that were injected with either the miR-124 mimic (upper row), inhibitor (lower row), or left un-injected (middle row). D, G, J, M. Schematic representation of the different treatments that were applied to the sensorimotor co-cultures for electrophysiological experiments. In each co-culture, one of the two sensory neurons was injected either with 5 μM miR-124 mimic (D), miR mimic negative control (G), miR-124 inhibitor (J), or miR inhibitor negative control (M), whereas the other sensory neuron was left untreated as a control. E, H, K, N. Graphs reporting the percentage change in EPSP amplitude measured at 24 hrs and 48 hrs after 5x5HT application with respect to pretreatment values in the different experimental groups. F, I, L, O. Bar graphs showing the average amplitude of EPSPs measured at synapses formed by SN1 and SN2 before injection and 5HT treatment in the different experimental groups to control for any change in basal synaptic strength that might contribute to observed changes in LTF. P. An alternate miR-124 inhibition method was employed. Sensory neurons treated anywhere from 4 hrs to 24 hrs with 2-O-methyl oligonucleotides antisense to miR-124 conjugated to penetratin show a significant reduction in endogenous miR-124 levels, as compared with untreated cells, or cells treated with a control 2′O-methyl oligonucleotide antisense to miR-194 also conjugated to penetratin. Q. Bar graph showing the mean amplitude of EPSPs measured at cultured sensorimotor synapses 24 hrs after the bath application of either a penetratin-conjugated miR-124 inhibitor (200 nM) or a control penetratin-conjugated miR-194. The bath application the miR-124 inhibitor does not significantly alter the average basal synaptic strength of sensorimotor synapses as compared with controls. R. Bar graph showing the average percentage synaptic facilitation measured at 24 hrs after treatment with either 0 or 5 serotonin pulses in cultures that had been pre-incubated with either the penetratin-conjugated miR-124 inhibitor or the control penetratin-conjugated miR-194 inhibitor. The miR-124 down-regulation enhances facilitation but only in the presence of 5HT.
Figure 6
Figure 6. miR-124 directly regulates CREB and facilitates the switch that converts short-term into long-term synaptic facilitation
A. A Northern blot with 10 μg total RNA from Aplysia pleural ganglia loaded in each lane, after treatment with either 2′-O-methyl oligonucleotides antisense to miR-124 conjugated to penetratin, or with 2′-O-methyl control oligonucleotides antisense to miR-194, or with vehicle alone. Blots are probed for miR-124 to show efficient and specific knockdown of miR-124 by penetratin conjugates. Blots were re-probed to detect tRNA, without stripping, to verify equal loading of all lanes. Level of knockdown is quantified by taking the mean % reduction of antisense miR-124 as compared to antisense miR-194 over 4 independent trials ± S.D. B. A Western blot loaded with 15 μg total protein in each lane, after treatment with either 2′-O-methyl oligonucleotides antisense to miR-124 conjugated to penetratin, or with 2′-O-methyl control oligonucleotides antisense to miR-194, or with vehicle alone. CREB1, and three of its downstream targets, kinesin heavy chain (KHC), CAAT enhancer binding protein (C/EBP), and ubiquitin C-terminal hydrolase (UCH) are up-regulated after miR-124 inhibition. CREB2 and MAPK are not altered by miR-124. All blots were re-probed with beta tubulin, to verify equal loading of all lanes. Changes in protein levels were quantified as a ratio of band intensity between anti-miR-124 and control oligo treatment, after each was normalized to the loading control. Data is shown as a mean of 10 independent trials for CREB1 and at least 5 for all others ± S.D. C. The miR-124 target site in the Aplysia CREB1 UTR is shown, along with the constructs used for the following reporter assay. A luciferase reporter (100ng) bearing the CREB UTR (full CREB UTR) is repressed by 45% when co-transfected with miR-124 duplex (5pmol) in HEK293 cells. The same reporter, when co-transfected with let-7, shows no significant change in expression levels. Luciferase reporters bearing the CREB UTR with a 2nt mutation in the miR-124 binding site (mutated CREB UTR), and a truncated CREB UTR that is missing the entire miR-124 binding site (truncated CREB UTR) are not significantly affected by co-transfection with miR-124 duplexes. An siRNA directed against the luciferase firefly gene (luc siRNA), a positive control, was able to repress all constructs containing the firefly gene by 80%. Each data point is expressed as a ratio of renilla to firefly activity, normalized to the change in luciferase activity when plasmids are transfected alone without miR duplexes. Data is shown as a mean of 8 independent trials ± S.D. D. Fold increase in transcript levels of CREB1, KHC, UCH, and C/EBP after inhibition of miR-124, as detected by real time reverse-transcription PCR. Proteins downstream to CREB (KHC, UCH, and C/EBP) have significantly increased transcript levels, whereas a transcript not known to be an immediate early gene of CREB, neurexin shows no such increase. Transcript levels were normalized to GAPDH and data is presented as a mean of 5 independent trials ± S.D. E. Bar graph showing the average percentage synaptic facilitation measured at 24 hrs after treatment with a single pulse of serotonin in cultures that had been pre-incubated with either the penetratin-conjugated miR-124 inhibitor or the control miR-194 inhibitor, as well as of untreated controls. The observed differences in the facilitation between the different groups were not due to differences in the basal strength of the synaptic connections as tested before 5HT application.

Comment in

  • MicroRNAs in memory processing.
    Fischbach SJ, Carew TJ. Fischbach SJ, et al. Neuron. 2009 Sep 24;63(6):714-6. doi: 10.1016/j.neuron.2009.09.007. Neuron. 2009. PMID: 19778498

Similar articles

Cited by

References

    1. Alberini CM, Ghirardi M, Metz R, Kandel ER. C/EBP is an immediate-early gene required for the consolidation of long-term facilitation in Aplysia. Cell. 1994;76:1099–114. - PubMed
    1. Aravin AA, Lagos-Quintana M, Yalcin A, Zavolan M, Marks D, Snyder B, Gaasterland T, Meyer J, Tuschl T. The small RNA profile during Drosophila melanogaster development. Dev Cell. 2003;5:337–50. - PubMed
    1. Ashraf SI, McLoon AL, Sclarsic SM, Kunes S. Synaptic protein synthesis associated with memory is regulated by the RISC pathway in Drosophila. Cell. 2006;124:191–205. - PubMed
    1. Barco A, Alarcon JM, Kandel ER. Expression of constitutively active CREB protein facilitates the late phase of long-term potentiation by enhancing synaptic capture. Cell. 2002;108:689–703. - PubMed
    1. Bartel DP. MicroRNAs: target recognition and regulatory functions. Cell. 2009;136:215–33. - PMC - PubMed

Publication types

MeSH terms