. 2009 Sep 24;63(6):830-42.
doi: 10.1016/j.neuron.2009.09.010.

Precise subcellular input retinotopy and its computational consequences in an identified visual interneuron

Affiliations

Precise subcellular input retinotopy and its computational consequences in an identified visual interneuron

Simon P Peron et al. Neuron. .

Abstract

The Lobula Giant Movement Detector (LGMD) is a higher-order visual interneuron of Orthopteran insects that responds preferentially to objects approaching on a collision course. It receives excitatory input from an entire visual hemifield that anatomical evidence suggests is retinotopic. We show that this excitatory projection activates calcium-permeable nicotinic acetylcholine receptors. In vivo calcium imaging reveals that the excitatory projection preserves retinotopy down to the level of a single ommatidium. Examining the impact of retinotopy on the LGMD's computational properties, we show that sublinear synaptic summation can explain orientation preference in this cell. Exploring retinotopy's impact on directional selectivity leads us to infer that the excitatory input to the LGMD is intrinsically directionally selective. Our results show that precise retinotopy has implications for the dendritic integration of visual information in a single neuron.


Figures
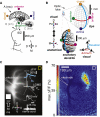
Figure 1
Figure 1
Ca2+ response in the LGMD's excitatory dendrite following localized visual stimuli. (A) Reconstructed LGMD (adapted from Peron et al., 2007). Arrows indicate anatomical directions (dorsal, ventral, medial, and lateral). Colored text and dots indicate position in visual space of impinging synaptic input. (B) The morphology of the LGMD approximates that of the locust eye, both of which are shown to scale at top. Colored text and dots near eye denote position in visual space. The red line denotes the equator (elevation = 0°), along which azimuth is measured; azimuth = 0° at the anterior pole. Elevation varies along the blue line; the red and blue lines intersect at elevation = 0° and azimuth = 90°. Arrows denote dorsal, lateral, and posterior in visual space, illustrating measurement of azimuth and elevation angles. The projection from visual space to LGMD anatomical space is shown in the left inset; visual anterior, posterior, dorsal and ventral correspond to anatomical lateral, medial, dorsal, and ventral, respectively. Throughout, the visual coordinates of synaptic inputs will be employed. (C) Image of an OGB-I filled LGMD neuron employed in a visual stimulation experiment (stimulus: 50 ms OFF flash of a 20°-by-20° box). Yellow region was used for background subtraction while cyan denotes the ROI used to calculate the ΔF/F trace shown in the same color. A grey line depicts stimulus timing. Intracellular Vm is shown on the time scale of the ΔF/F time series, as well as in a magnified form with the corresponding nerve cord recording. Colored dots (anterior, posterior, dorsal, ventral) correspond to the position in visual space of the incoming inputs from the eye. (D) Maximal ΔF/F at each pixel in (C) following stimulus presentation.
Figure 2
Figure 2
The excitatory dendritic field's inputs preserve the topography of visual space at the coarse scale. (A) Raw responses to distributed stimuli in a sample LGMD neuron. OFF stimuli were employed across a 100°-by-100° area divided into a grid of 25 20°-by-20° squares. The inset color code matches the color of the fluorescence response superimposed over the raw fluorescence image (coordinates are in visual space; positions eliciting no response are outlined in white). At each of 5 depths, pixel groups meeting our 85%, 10 connected pixels criteria were recorded (see Experimental Procedures); each colored area corresponds to the union of such groups across depths and fields-of-view for a particular stimulus site. Directional arrows correspond to the position in visual space of the incoming inputs from the eye (see Figure 1). (B) Centers-of-mass (COM) for the responding regions shown in (A). The dendritic field's origin and major axis are indicated with red and dotted white lines, respectively. (C) Normalized COM positions across cells (N=7; lines indicate s.e.m.). The black points indicate the normalized positions of all points with a given azimuth or elevation.
Figure 3
Figure 3
The excitatory dendritic field's inputs preserve the topography of visual space at the fine scale. (A) 50 ms, 0.5°-by-0.5° ON stimulus produces a response that is indistinguishable from single ommatidial stimulation. From top to bottom, Vm response to 20°-by-20° OFF (red; N=23 presentations, 4 sites), 0.5°-by-0.5° ON (black; N=150 presentations, 25 sites), single ommatidial ON (blue; with 0.5°-by-0.5° response superimposed; N=10 ommatidia) and OFF (green; N=19 ommatidia) stimulation with s.e.m. envelopes. (B) Raw fluorescence responses to fine-scale stimuli. The color in the stimulus position-indicating inset corresponds to the color of the fluorescence response. Actual stimuli were 0.5°-by-0.5°, with a 2° centerwise spacing between adjacent sites. The 85% threshold employed in Figure 2A was applied here. (C) Centers-of-mass (COM) for the responding regions shown in (B). Points (4/25) violating retinotopy are outlined in white, with position shifts that would result in retinotopy preservation indicated. Directional arrows correspond to the position in visual space of the incoming inputs from the eye (see Figure 1).
Figure 4
Figure 4
The LGMD responds more strongly to appearing vertical bars than horizontal bars. (A) In vivo response to 80°-by-5° bar stimuli (50 ms OFF). A schematic of the LGMD excitatory dendritic field is shown with expected positions of synapses activated by vertical (red) and horizontal (blue) bars. Below, the nerve cord response to a single 50 ms OFF presentation of a vertical bar is depicted, above rasters for 5 trials of vertical and horizontal bars. The gaussian-convolved (σ = 20 ms) mean instantaneous frequency response for the animal for which rasters (N=5 trials) are shown and the cross-animal (N=43 trials, pooled over 7 animals) average are depicted with envelopes indicating response s.e.m. Stimulus timing is indicated at the bottom of the panel. (B) Response of simulated LGMD to 80°-by-5° bar stimuli. The top inset shows the model, which consisted of a spiking axon (red), a region for KCa-mediated spike-frequency adaptation (blue), feed-forward inhibitory input (green), and an excitatory dendrite receiving input from visual space as indicated (see Experimental Procedures). The directional arrows (anterior, posterior, dorsal, ventral) correspond to the orientation in visual space of the incoming inputs from the eye (see Figure 1). A sample response to a vertical bar presentation is shown below, with rasters for 10 trials each of horizontal and vertical bars following. Finally, the gaussian-convolved mean instantaneous frequency response across simulations is shown, with light shading indicating s.e.m. (C) Summary data for in vivo and simulated response for various bar sizes. Maximal instantaneous frequency (fmax) response for vertical and horizontal bar responses are shown in red and blue, respectively. An asterisk (*) denotes a significant difference in horizontal vs. vertical bar response at the p < 0.05 level (Wilcoxon signed rank test; see Table S1; simulated data not tested).
Figure 5
Figure 5
The LGMD exhibits directional selectivity to translating motion that cannot be explained by the organization of the synaptic projection alone. (A) LGMD-DCMD response to translation by a black 10°-by-10° square moving in an anterior-posterior direction at 40°/s. The top trace shows a sample nerve cord recording, with spike rasters below. The gaussian-convolved (σ = 20 ms) mean instantaneous frequency response for the animal for which rasters (N=5 trials) are shown and the cross-animal (N=35, 5 trials per animal) average are shown with s.e.m. envelopes. The azimuth of the translating square's center is indicated below; elevation was always 0°. (B) Directional selectivity at the level of maximal frequency (fmax; red) and steady-state frequency (fss; blue) for translating stimuli moving in the anterior-posterior (AP), posterior-anterior (PA), dorso-ventral (DV), and ventro-dorsal (DV) directions. Each circular plot indicates fmax or fss for each of the four stimulus directions, with lines indicating s.e.m. across animals (N=7). fss was defined as the mean frequency from 250 ms after motion onset to motion termination (light-blue; N=35, 5 per animal). (C) Simulated LGMD's response to a 10°-by-10° square translating in an AP direction at 40°/s. A sample response is shown with raster plots for 10 trials. The gaussian-convolved mean instantaneous frequency response is shown below (N=10 trials), with stimulus position indicated at the bottom of the panel. (D) Directional selectivity in the model; same conventions as in (B).
Figure 6
Figure 6
Both the peak firing rate and synaptic calcium response of the LGMD are directionally selective for local motion stimuli. (A) LGMD/DCMD response to drifting grating, consisting of two 5°-by-20° black edges separated by 5° white regions moving in a 20°-by-20° square at 40 °/s in an AP direction. To avoid net luminance change, the background luminance was 50%. The top trace shows a sample nerve cord recording with large DCMD spikes, with the raster for several trials and the gaussian-convolved mean instantaneous frequency with s.e.m. envelopes shown below (N=3 trials). The average instantaneous frequency pooled across animals (N=15 trias, 3 per animal) is shown below. This particular stimulus was centered in anterior visual space (azimuth 60°, elevation 0°). (B) Directional selectivity at the level of fmax, with mean instantaneous frequency responses pooled across animals shown for each direction of drift for the same stimulus position as in (A). The circular plot indicates fmax for each direction, with the line indicating cross-animal s.e.m. (N=5). (C) Directional selectivity at the level of fmax for four different stimulus positions. (D) Sample calcium responses for all four directions of motion. For each motion direction, a sample maximal ΔF/F response to anterior (azimuth 60°, elevation 0°) stimuli is shown. The regions outlined in white correspond to the regions-of-interest (ROIs); on the DV motion panel, ROIs are outlined in color, corresponding to the color in which ΔF/F versus time is shown for each ROI and stimulus. Directional arrows correspond to the position in visual space of the incoming inputs from the eye (see Figure 1). (E) Directional selectivity at the level of maximal ΔF/F within each of the four ROIs in (D). The color code corresponds to the ROI's position. For each animal-ROI combination, data was normalized to the maximal ΔF/F observed, and each value on the circular plot indicates the average instantaneous frequency pooled across animals (N=15 trials, over 5 animals; lines indicate s.e.m.) is shown below.

Similar articles

Cited by

References

    1. Anderson JC, Binzegger T, Kahana O, Martin KA, Segev I. Dendritic asymmetry cannot account for directional responses of neurons in visual cortex. Nat Neurosci. 1999;2:820–4. - PubMed
    1. Baden T, Hedwig B. Neurite-specific Ca2+ dynamics underlying sound processing in an auditory interneurone. Dev Neurobiol. 2007;67:68–80. - PubMed
    1. Bollmann JH, Engert F. Subcellular topography of visually driven dendritic activity in the vertebrate visual system. Neuron. 2009;61:895–905. - PMC - PubMed
    1. Borst A, Egelhaaf M. In vivo imaging of calcium accumulation in fly interneurons as elicited by visual motion stimulation. Proc Natl Acad Sci U S A. 1992;89:4139–43. - PMC - PubMed
    1. Borst A, Egelhaaf M, Haag J. Mechanisms of dendritic integration underlying gain control in fly motion-sensitive interneurons. J Comput Neurosci. 1995;2:5–18. - PubMed

Publication types

MeSH terms

LinkOut - more resources