. 2009 Sep 24;63(6):843-53.
doi: 10.1016/j.neuron.2009.09.004.

Dynamics of fast and slow inhibition from cerebellar golgi cells allow flexible control of synaptic integration

Affiliations

Dynamics of fast and slow inhibition from cerebellar golgi cells allow flexible control of synaptic integration

John J Crowley et al. Neuron. .

Abstract

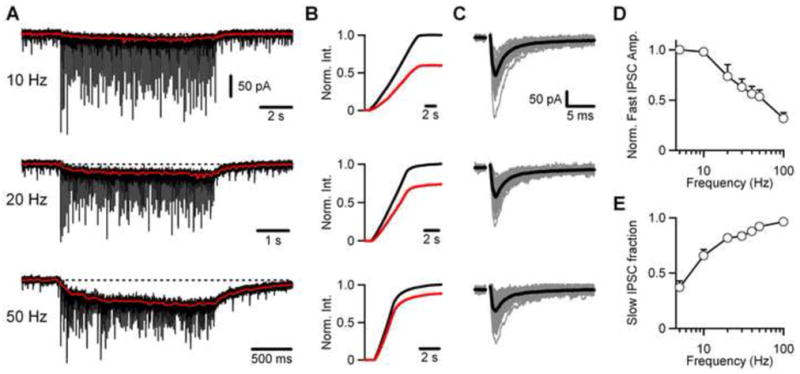
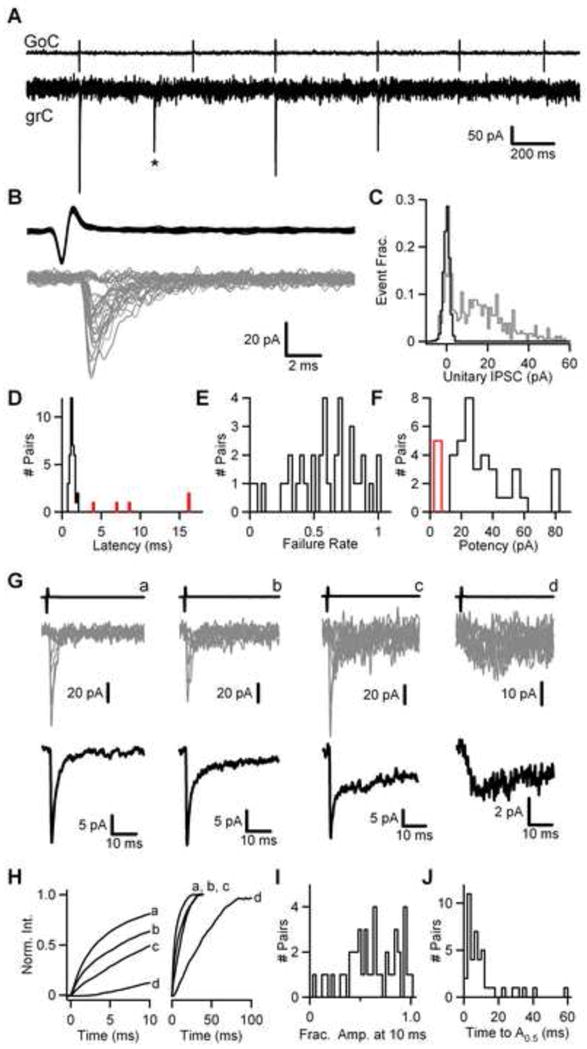
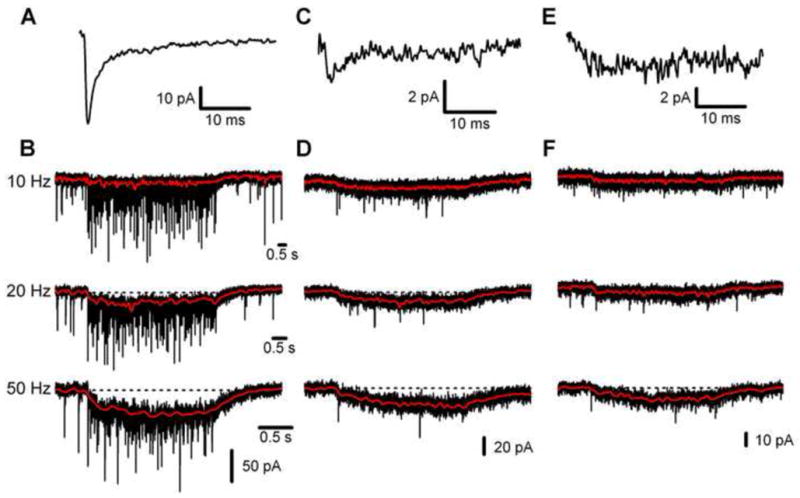
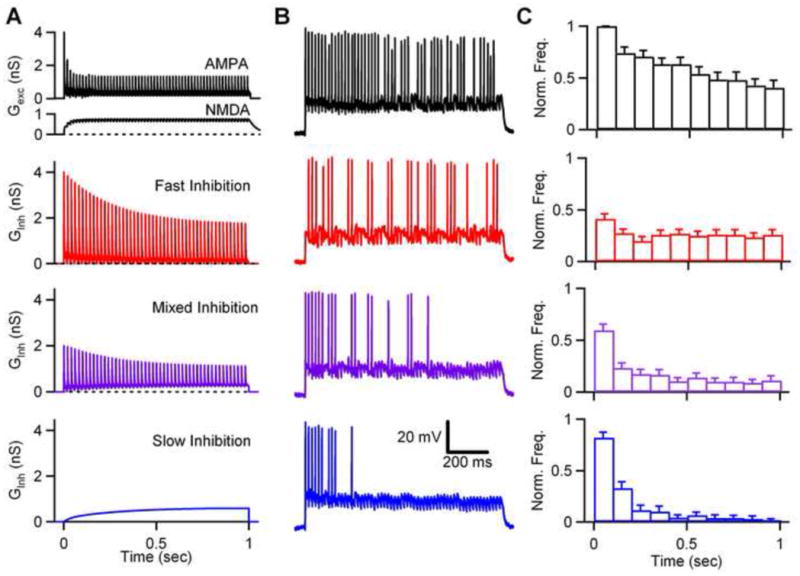
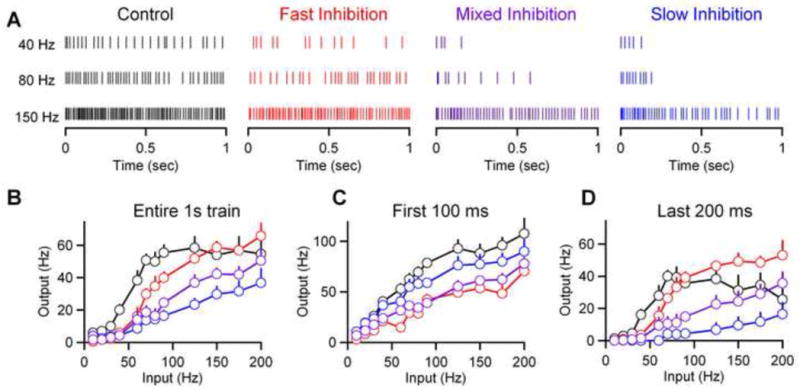
Throughout the brain, multiple interneuron types influence distinct aspects of synaptic processing. Interneuron diversity can thereby promote differential firing from neurons receiving common excitation. In contrast, Golgi cells are the sole interneurons regulating granule cell spiking evoked by mossy fibers, thereby gating inputs to the cerebellar cortex. Here, we examine how this single interneuron class modifies activity in its targets. We find that GABA(A)-mediated transmission at unitary Golgi cell --> granule cell synapses consists of varying contributions of fast synaptic currents and sustained inhibition. Fast IPSCs depress and slow IPSCs gradually build during high-frequency Golgi cell activity. Consequently, fast and slow inhibition differentially influence granule cell spike timing during persistent mossy fiber input. Furthermore, slow inhibition reduces the gain of the mossy fiber --> granule cell input-output curve, while fast inhibition increases the threshold. Thus, a lack of interneuron diversity need not prevent flexible inhibitory control of synaptic processing.


Figures

Figure 1
Figure 1. Frequency dependence of fast and slow IPSCs at the Golgi cell → granule cell synapse
(A) Representative traces of IPSCs recorded in a granule cell in response to trains of extracellular stimulation at 10, 20, and 50 Hz. Each train is the average of three trials of 100 stimuli at each frequency. The superimposed red traces depict the slow component of the IPSC (see Figure S1), and the dotted line denotes the baseline current. (B) Normalized integrals of the total IPSC (black lines) and the slow IPSC (red lines) during the trains shown in A. (C) Individual fast IPSCs (grey traces) are shown superimposed and baseline subtracted, along with the average event (black trace) for each train shown in A. (D) Normalized fast IPSC amplitude versus frequency (n=4 cells). (E) Average fraction of IPSC charge carried by the slow IPSC versus frequency (n=4 cells).
Figure 2
Figure 2. Diversity in the contribution of fast and slow IPSCs at individual Golgi cell → granule cell connections
(A) Representative recording of spontaneous activity at a Golgi cell → granule cell connection, showing spikes in the presynaptic Golgi cell (upper) and the corresponding responses in the granule cell (lower). The asterisk denotes an event not temporally linked to spiking in the Golgi cell being monitored. (B) 25 superimposed Golgi cell spikes (upper), and corresponding granule cell IPSCs (lower, grey traces) from the experiment shown in B. (C) Normalized amplitude histogram of 500 events from the same experiment (grey), along with an amplitude histogram of the baseline preceding the event (black). (D) Histogram of the IPSC latency, defined as time between the peak of the downward deflection of the presynaptic spike and the peak of the first derivative of the average unitary IPSC. Pairs lacking a fast IPSC are shown in red. Histogram of failure rate (E) and potency (F) for 36 Golgi cell → granule cell connections. The average unitary IPSC amplitude for 5 additional pairs lacking a fast IPSC are shown in red. (G) Sample traces from four individual Golgi cell → granule cell connections (a–d) depicting the average presynaptic spike (upper), 10 superimposed IPSCs (middle, grey) and the average unitary IPSC (lower, black) from 58 to 253 events at each pair. (H) Average unitary IPSCs from (G) are shown integrated and normalized to their peak. The integrated currents are plotted over the first 10 ms (left) and 100 ms (right). (I) Histogram of the fractional amplitude at 10 ms of IPSCs from 42 Golgi cell → granule cell connections. (J) Histogram of the half-amplitude times for the same IPSCs shown in (I).
Figure 3
Figure 3. Using channelrhodopsin-2 to study individual Golgi cell → granule cell synapses
(A) Schematic depicting the typical region, a box around the soma, used for light activation of Golgi cells. A whole-cell electrode was used to monitor membrane potential during light activation of the cell. (B) Representative recording of ChR2-evoked depolarization of a Golgi cell with brief stimulus (denoted by the blue bar) of increasing intensity (1 ms pulse, 1 – 2 V applied to 50 mW 473 nm laser). (C) Sample recording of the entrainment of Golgi cell firing with brief suprathreshold blue light pulses (denoted by the blue bars). (D) Example recording from a ChR2-expressing Golgi cell of a train of 100 1 millisecond light pulses delivered at 50 Hz in voltage clamp (upper) and current clamp (lower). (E) Representative paired recording with a ChR2-expressing Golgi cell. An on-cell electrode was used to monitor Golgi cell spikes and unitary IPSCs were recorded from a granule cell with a whole-cell electrode. IPSCs were recorded either during spontaneous Golgi cell firing (left, black) or when Golgi cells were stimulated with light at approximately the rate of spontaneous firing (right, blue). (F) Overlay of 25 granule cell IPSCs, along with the average unitary IPSC, from spontaneous activity (left, grey/black traces) or from ChR2-evoked activity (right, light/dark blue traces). The average unitary IPSC from spontaneous firing (far right, black trace) is shown overlayed with the average ChR2-evoked current (far right, blue trace). (G) Summary plot of the average spontaneous IPSC amplitude plotted against the average ChR2-evoked IPSC amplitude (n= 7 pairs).
Figure 4
Figure 4. Properties of IPSCs evoked by trains of activity at diverse Golgi cell → granule cell pairs
Properties of single Golgi cell → granule cell synapses were examined using spontaneous activity to determine the average IPSC (A, C, E), as in Fig. 2, and using light to evoke spikes in ChR2 expressing cells at 10 Hz, 20 Hz, and 50 Hz (B, D, F). In the first pair (A, B) a large reliable fast IPSC was observed (A, 82 events), in the second pair (C, D) smaller fast IPSCs occurred only at low rates (B, 100 events), and the third connection (E, F) contained only a small slow IPSC (C, 94 events). (B, D, F) The red traces depict the slow component of the IPSC during stimulus trains, and the dotted lines denote the baseline current.
Figure 5
Figure 5. Differential effects of fast and slow inhibition on the timing of spikes evoked by trains of excitation in granule cells
Dynamic clamp was used to examine the spiking evoked in granule cells by trains of mossy fiber activity. The properties of AMPA and NMDA conductances were determined by activating mossy fibers and measuring the resulting EPSCs in granule cells (Figure S3). AMPA and NMDA conductances are shown for 60 Hz stimulation in a sample cell (A, black). The conductance waveforms are also shown for inhibition consisting of either fast inhibition alone (A, red), slow inhibition alone (A, blue), or mixed inhibition (A, purple) evoked by a 50 Hz train of Golgi cell activity. The inhibitory charge carried by fast and slow inhibition was equal in all experiments. (B) Dynamic clamp studies were performed using excitatory conductances alone (black), and excitatory conductances accompanied by either fast inhibition (red), slow inhibition (blue), or mixed inhibition (purple). In all experiments a small tonic inhibitory conductance (0.1 – 0.3 pS) was also present. Representative traces of granule cell spiking are shown for control (black), fast inhibition (red), slow inhibition (blue), and mixed inhibition (purple). (C) Histograms of spike frequencies (normalized to the first 100 ms in control conditions) are plotted as a function of time for each condition (n=17 cells).
Figure 6
Figure 6. Fast and slow inhibition differentially alter the input-output curve at the mossy fiber → granule cell synapse
Dynamic clamp experiments were conducted as in Fig. 5 with trains of mossy fiber activity at frequencies of 10 Hz to 200 Hz using excitatory conductances alone (black), and in the presence of fast inhibition (red), slow inhibition (blue), or mixed inhibition (purple). (A) Raster plots of spikes evoked in granule cells at 40 Hz, 80 Hz, and 150 Hz are shown for each condition. (B) Average input-output curves are shown with input frequencies corresponding to the frequency of mossy fiber input trains and output frequencies corresponding to granule cell spiking (n= 9 cells). (C) Input-output curves from the same data set, considering only spiking in the first 100 ms (left) or last 200 ms (right) of the conductance injection.

Comment in

Similar articles

Cited by

References

    1. Aitkin LM, Boyd J. Acoustic input to the lateral pontine nuclei. Hear Res. 1978;1:67–77. - PubMed
    1. Bacci A, Rudolph U, Huguenard JR, Prince DA. Major differences in inhibitory synaptic transmission onto two neocortical interneuron subclasses. J Neurosci. 2003;23:9664–9674. - PMC - PubMed
    1. Balakrishnan V, Kuo SP, Roberts PD, Trussell LO. Slow glycinergic transmission mediated by transmitter pooling. Nat Neurosci. 2009;12:286–294. - PMC - PubMed
    1. Banks MI, White JA, Pearce RA. Interactions between distinct GABA(A) circuits in hippocampus. Neuron. 2000;25:449–457. - PubMed
    1. Best AR, Regehr WG. Inhibitory regulation of electrically coupled neurons in the inferior olive is mediated by asynchronous release of GABA. Neuron. 2009;62:555–565. - PMC - PubMed

Publication types

MeSH terms

LinkOut - more resources