Spatial attention decorrelates intrinsic activity fluctuations in macaque area V4
- PMID: 19778515
- PMCID: PMC2765230
- DOI: 10.1016/j.neuron.2009.09.013
Spatial attention decorrelates intrinsic activity fluctuations in macaque area V4
Abstract
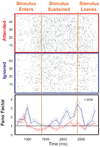
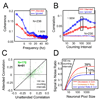
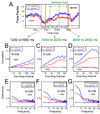
Attention typically amplifies neuronal responses evoked by task-relevant stimuli while attenuating responses to task-irrelevant distracters. In this context, visual distracters constitute an external source of noise that is diminished to improve attended signal quality. Activity that is internal to the cortex itself, stimulus-independent ongoing correlated fluctuations in firing, might also act as task-irrelevant noise. To examine this, we recorded from area V4 of macaques performing an attention-demanding task. The firing of neurons to identically repeated stimuli was highly variable. Much of this variability originates from ongoing low-frequency (<5 Hz) fluctuations in rate correlated across the neuronal population. When attention is directed to a stimulus inside a neuron's receptive field, these correlated fluctuations in rate are reduced. This attention-dependent reduction of ongoing cortical activity improves the signal-to-noise ratio of pooled neural signals substantially more than attention-dependent increases in firing rate.
Figures


Similar articles
-
Spatial attention modulates center-surround interactions in macaque visual area v4.Neuron. 2009 Mar 26;61(6):952-63. doi: 10.1016/j.neuron.2009.02.023. Neuron. 2009. PMID: 19324003 Free PMC article.
-
Neural mechanisms of spatial selective attention in areas V1, V2, and V4 of macaque visual cortex.J Neurophysiol. 1997 Jan;77(1):24-42. doi: 10.1152/jn.1997.77.1.24. J Neurophysiol. 1997. PMID: 9120566
-
Attention alters spatial integration in macaque V1 in an eccentricity-dependent manner.Nat Neurosci. 2007 Nov;10(11):1483-91. doi: 10.1038/nn1967. Epub 2007 Sep 30. Nat Neurosci. 2007. PMID: 17906622 Free PMC article.
-
Attention modulates the responses of simple cells in monkey primary visual cortex.J Neurosci. 2005 Nov 23;25(47):11023-33. doi: 10.1523/JNEUROSCI.2904-05.2005. J Neurosci. 2005. PMID: 16306415 Free PMC article.
-
Attentional modulation of visual processing.Annu Rev Neurosci. 2004;27:611-47. doi: 10.1146/annurev.neuro.26.041002.131039. Annu Rev Neurosci. 2004. PMID: 15217345 Review.
Cited by
-
Decorrelation by recurrent inhibition in heterogeneous neural circuits.Neural Comput. 2013 Jul;25(7):1732-67. doi: 10.1162/NECO_a_00451. Epub 2013 Apr 22. Neural Comput. 2013. PMID: 23607559 Free PMC article.
-
Natural grouping of neural responses reveals spatially segregated clusters in prearcuate cortex.Neuron. 2015 Mar 18;85(6):1359-73. doi: 10.1016/j.neuron.2015.02.014. Epub 2015 Feb 26. Neuron. 2015. PMID: 25728571 Free PMC article.
-
Balanced input allows optimal encoding in a stochastic binary neural network model: an analytical study.PLoS One. 2012;7(2):e30723. doi: 10.1371/journal.pone.0030723. Epub 2012 Feb 16. PLoS One. 2012. PMID: 22359550 Free PMC article.
-
Orientation selectivity and noise correlation in awake monkey area V1 are modulated by the gamma cycle.Proc Natl Acad Sci U S A. 2012 Mar 13;109(11):4302-7. doi: 10.1073/pnas.1114223109. Epub 2012 Feb 27. Proc Natl Acad Sci U S A. 2012. PMID: 22371570 Free PMC article.
-
Deformation of attractor landscape via cholinergic presynaptic modulations: a computational study using a phase neuron model.PLoS One. 2013;8(1):e53854. doi: 10.1371/journal.pone.0053854. Epub 2013 Jan 11. PLoS One. 2013. PMID: 23326520 Free PMC article.
References
-
- Abbott LF, Dayan P. The effect of correlated variability on the accuracy of a population code. Neural Comput. 1999 Jan 1;11(1):91–101. - PubMed
-
- Arieli A, Sterkin A, Grinvald A, Aertsen A. Dynamics of ongoing activity: explanation of the large variability in evoked cortical responses. Science. 1996 Sep 27;273(5283):1868–1871. 1996. - PubMed
-
- Averbeck BB, Latham PE, Pouget A. Neural correlations, population coding and computation. Nat Rev Neurosci. 2006;7:358–366. - PubMed
-
- Bair W, O’Keefe LP. The influence of fixational eye movements on the response of neurons in area MT of the macaque. Vis. Neurosci. 1998;15:779–786. - PubMed
Publication types
MeSH terms
Grants and funding
LinkOut - more resources
Full Text Sources
Other Literature Sources

