. 2009 Sep 25;16(9):980-9.
doi: 10.1016/j.chembiol.2009.07.010.

Chemical probes identify a role for histone deacetylase 3 in Friedreich's ataxia gene silencing

Affiliations

Chemical probes identify a role for histone deacetylase 3 in Friedreich's ataxia gene silencing

Chunping Xu et al. Chem Biol. .

Abstract

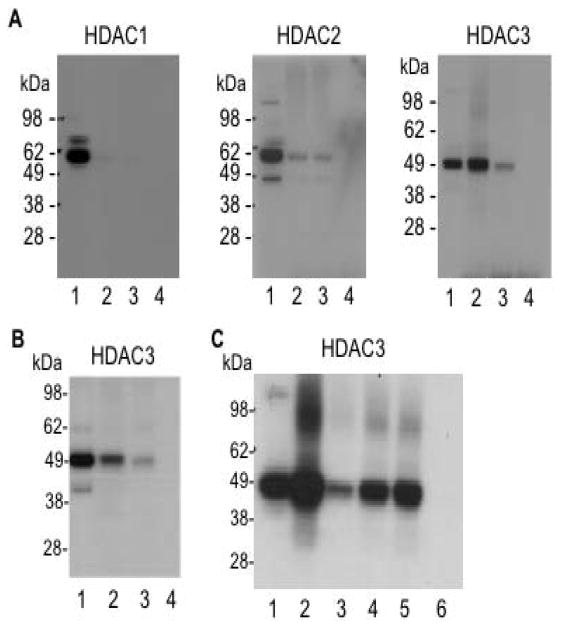
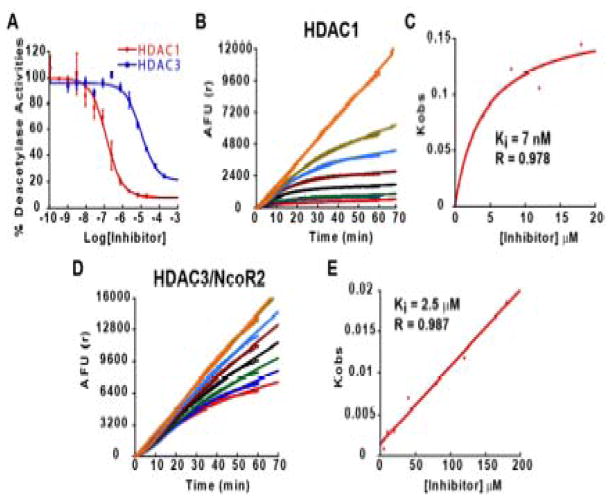
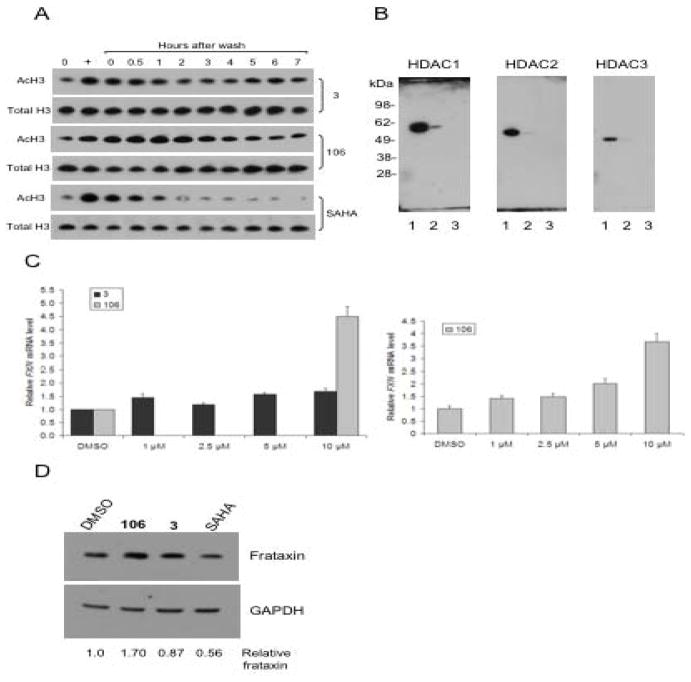
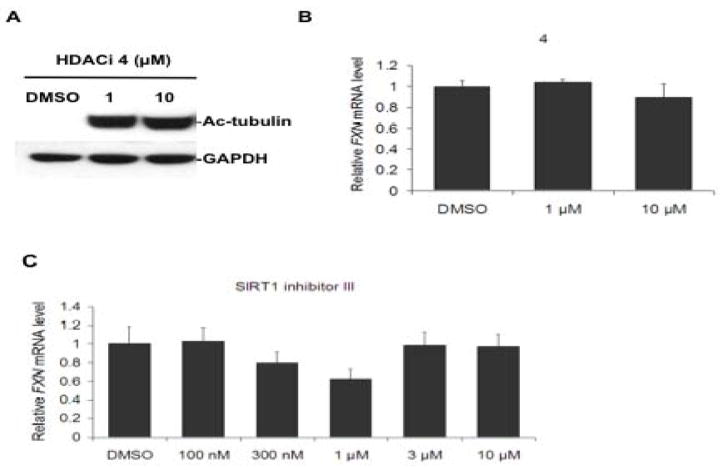
We recently identified a class of pimelic diphenylamide histone deacetylase (HDAC) inhibitors that show promise as therapeutics in the neurodegenerative diseases Friedreich's ataxia (FRDA) and Huntington's disease. Here, we describe chemical approaches to identify the HDAC enzyme target of these inhibitors. Incubation of a trifunctional activity-based probe with a panel of class I and class II recombinant HDAC enzymes, followed by click chemistry addition of a fluorescent dye and gel electrophoresis, identifies HDAC3 as a unique high-affinity target of the probe. Photoaffinity labeling in a nuclear extract prepared from human lymphoblasts with the trifunctional probe, followed by biotin addition through click chemistry, streptavidin enrichment, and Western blotting also identifies HDAC3 as the preferred cellular target of the inhibitor. Additional inhibitors with different HDAC specificity profiles were synthesized, and results from transcription experiments in FRDA cells point to a unique role for HDAC3 in gene silencing in Friedreich's ataxia.


Conflict of interest statement

Competing Interests

J.M.G. is a consultant to Repligen Corporation, and has a competing financial interest in this work. H.P. and J.R.R. are employees of Repligen Corporation.

Figures

Figure 1
Figure 1
Structures of HDAC inhibitors and activity-profiling probes: 106; the trifunctional probe 1-BP and its control derivative 2-BP, lacking a 2-amino group; the HDAC1/2-specific inhibitor 3 and the activity-profiling probe 3-BP; and, the class II HDAC inhibitor 4.
Figure 2
Figure 2
Photoaffinity labeling of recombinant HDAC enzymes. (a) 5 μg of each of the indicated recombinant HDAC enzymes were incubated with 1-BP (at 4 μM) for 5 min, followed by UV irradiation for 1 h, and rhodamine azide was added by click chemistry. A fluorescent image of an SDS-PAGE is shown and fluorescent dye markers are shown at the left of the gel. Note that HDAC3 consists of the enzyme plus its required cofactor NcoR2, which is a recombinant fragment that is also crosslinked by 1-BP. Minor bands at ~80 kDa and above represent multimers of HDAC3/NcoR2. Reactions for the class I HDACs 1, 2, 3 and 8 were analyzed on a separate gel from the reactions with the class II HDACs 4 and 5. (b) Competition with 106. HDAC3/NcoR2 was incubated with or without 106 at 10 μM, for 2 h at RT, prior to the addition of 1-BP (10 μM), followed by photocrosslinking and click chemistry as in a. (c) Determination of the half-life of the 1-BP/HDAC3 complex. 1-BP and recombinant HDAC3/NcoR2 were pre-incubated for 2 h prior to the addition of a 20-fold molar excess of 106, and samples were withdrawn at the indicated times, UV crosslinked and a rhodamine-azide was added by click chemistry. The inset shows a fluorescence image of an SDS-PAGE analysis of these samples, and the graph is a plot of the natural log of the fraction 1-BP/HDAC3 remaining at each time point, relative to the zero time point, versus time. ImageQuant software was used to quantify the data, which were normalized for HDAC3 protein concentration in each sample (determined by western blotting, not shown). A least-squares fit of the data (solid line, R2 = 0.934) yields a t1/2 of ~4 h.
Figure 3
Figure 3
(a) Photoaffinity crosslinking of proteins in a nuclear extract from FRDA lymphoblasts with 1-BP followed by addition of a biotin-azide by click chemistry, streptavidin binding, and western blotting with antibodies to the indicated HDACs. Lane 1, input (2% of the amount of total protein corresponding to lanes 2 – 4 used for affinity capture); lane 2, proteins retained on streptavidin beads; lane 3, same as lane 2 but with pre-incubation of a 20-fold excess of 106 prior to the addition of 1-BP to the extract; lane 4, no click chemistry control. (b) Photoaffinity crosslinking and capture with 1-BP or 2-BP (each at 4 μM) as above, and western blotting with antibody to HDAC3. Lane 1, input (2% of lanes 2 - 3); lane 2, proteins retained on streptavin beads after incubation with 1-BP; lane 3, proteins retained on streptavin beads after incubation with 2-BP, lacking a 2-amino group; lane 4, no click chemistry control. (c) Competition with 106, TSA and SAHA. Affinity capture with 1-BP (at 4 μM) as in panel a, and western blotting with antibody to HDAC3. Lane 1, input (2% of lanes 2 – 6); lane 2, proteins retained on streptavidin beads; lane 3, same as lane 2 but with pre-incubation with 106 (80 μM) for 1.5 h prior to the addition of 1-BP to the extract; lane 4, same as lane 3 but with pre-incubation with TSA (308 nM); lane 5, same as lane 3 but with pre-incubation with SAHA (3 μM); lane 6, no click chemistry control. In lanes 3 – 5, the amounts of competitor compounds correspond to 60-times the reported IC50 value for each inhibitor.
Figure 4
Figure 4
IC50 and Ki determinations for 3 determined with recombinant HDAC1 or HDAC3/NcoR2. (a) IC50 determinations were performed as described (Chou et al., 2008) with a 1 h pre-incubation of HDAC1 or HDAC3/NcoR2 and inhibitor prior to adding substrate. Enzyme progression curves for HDAC1 (b) or HDAC3/NcoR2 (d) in the presence of increasing concentrations of 3. In panel b, the curves, starting at the top, represent the following final concentrations of inhibitor: no inhibitor, 0.5 μM, 1 μM, 2 μM, 4 μM, 8 μM, 12 μM, and 18 μM. In panel d, the curves represent the following final concentrations of inhibitor: no inhibitor, 5 μM, 10 μM, 20 μM, 40 μM, 80 μM, 120 μM, and 180 μM. Plots of Kobs versus inhibitor concentration for HDAC1 (c) and HDAC3/NcoR2 (e), as in (Chou et al., 2008). For HDAC1, the data are best fit to a slow-on/slow-off inhibition mechanism involving a stable intermediate, while for HDAC3/NcoR2 a simple slow-on/slow-off mechanism provides the best fit to the data. Ki and R values (from the least-squares fit to the data) are shown in the figure, while IC50 values are given in Table 1 (Supplemental material).
Figure 5
Figure 5
Effects of HDAC inhibitor 3 in FRDA cells. (a) Histone acetylation in FRDA cells. FRDA lymphoblasts were either untreated (DMSO vehicle control, marked 0 at top) or treated with HDACi 3 (top panels) or 106 (middle panels) at 10 μM, or with SAHA at 2 μM for 24 h (lane marked with “+” at top), washed to remove the inhibitors, and the cells were suspended in fresh medium lacking inhibitors. Aliquots of cells were harvested at the indicated times (lanes marked 0 – 7 h), protein extracts prepared and subjected to western blotting with antibody to unacetylated histone H3 as a loading control (indicated Total H3) or antibody to acetylated histone H3 (K9 + K14; indicated Ac-H3) for each of the inhibitors. (b) Photoaffinity crosslinking of proteins in a nuclear extract from FRDA lymphoblasts with 3-BP followed by addition of a biotin-azide by click chemistry, streptavidin binding, and western blotting with antibodies to the indicated HDACs. Lane 1, input (4% of the amount of total protein corresponding to lanes 2 – 3 used for affinity capture); lane 2, proteins retained on streptavidin beads; lane 3, same as lane 2 but no click chemistry control (omission of the Cu(I) regent). (c) Effects of HDACi 3 and 106 on FXN gene expression in primary lymphocytes from FRDA patients. Lymphocytes were isolated from donor blood from a FRDA patient and were incubated in culture media containing either 0.4% DMSO, as a control, or 106 or the 5-phenyl compound 3, each at the indicated concentrations in 0.4% DMSO, for 48 h prior to determination of mRNA levels by qRT-PCR, using GAPDH mRNA as an internal control. The y-axis denotes FXN mRNA levels, normalized to GAPDH mRNA, relative to the DMSO controls, set to 1.0. Each determination was done in triplicate, and the SEM is shown. A separate dose response experiment for 106 is shown at the right. (d) Effects of HDACi 3, 106 and SAHA on frataxin protein expression in FRDA lymphoblasts. Cells were incubated with each inhibitor (at 10 μM for 106 or 3 and at 2 μM for SAHA, in culture media plus 0.1% DMSO or media plus DMSO as a control) for 48 h prior to analysis by western blotting for frataxin or GAPDH, as indicated. The x-ray films were scanned and quantified, and the relative levels of frataxin protein, normalized to GAPDH protein, are shown at the bottom of the figure.
Figure 6
Figure 6
A class II HDAC inhibitor and a Sirt1 inhibitor fail to activate FXN gene expression. (a) Class II HDAC inhibitor 4 causes tubulin acetylation in FRDA cells. FRDA lymphoblasts were incubated with the indicated concentrations of 4 or DMSO alone (at 0.1%) for 24 h in culture medium, prior to SDS-PAGE and western blotting with anti-ac-tubulin antibody, or antibody to GAPDH, as a loading control. (b) HDAC inhibitor 4 fails to activate FXN gene expression. FRDA lymphoblasts were incubated in culture media containing either 0.1% DMSO, as a control, or 4, at the indicated concentrations in 0.1% DMSO, for 24 h prior to determination of FXN mRNA levels by qRT-PCR, using GAPDH mRNA as an internal control. The y-axis denotes FXN mRNA levels, normalized to GAPDH mRNA, relative to the DMSO control, set to 100%. Each determination was done in triplicate, and the SEM is shown. (c) The Sirt1 inhibitor 6-chloro-2,3,4,9-tetrahydro-1H-carbazole-1-carboxamide fails to up-regulate FXN gene expression in primary lymphocytes from a FRDA patient. Lymphocytes were incubated in culture media containing either 0.4% DMSO, as a control, or with the indicated concentrations of inhibitor in 0.4% DMSO, for 48 h prior to determination of mRNA levels by qRT-PCR, using GAPDH as an internal control, as in panel b.

References

    1. Broide RS, Redwine JM, Aftahi N, Young W, Bloom FE, Winrow CJ. Distribution of histone deacetylases 1-11 in the rat brain. J Mol Neurosci. 2007;31:47–58. - PubMed
    1. Butler KV, Kozikowski AP. Chemical origins of isoform selectivity in histone deacetylase inhibitors. Curr Pharm Des. 2008;14:505–528. - PubMed
    1. Chou CJ, Herman D, Gottesfeld JM. Pimelic diphenylamide 106 is a slow, tight-binding inhibitor of class I histone deacetylases. J Biol Chem. 2008;283:35402–35409. - PMC - PubMed
    1. Ebert AD, Yu J, Rose FF, Mattis VB, Lorson CL, Thomson JA, Svendsen CN. Induced pluripotent stem cells from a spinal muscular atrophy patient. Nature. 2008;457:277–280. - PMC - PubMed
    1. Evans MJ, Cravatt BF. Mechanism-based profiling of enzyme families. Chem Rev. 2006;106:3279–3301. - PubMed

Publication types

MeSH terms