. 2010 Mar;17(3):398-407.
doi: 10.1038/cdd.2009.135. Epub 2009 Sep 25.

p73 is essential for vitamin D-mediated osteoblastic differentiation

Affiliations

p73 is essential for vitamin D-mediated osteoblastic differentiation

R Kommagani et al. Cell Death Differ. 2010 Mar.

Abstract

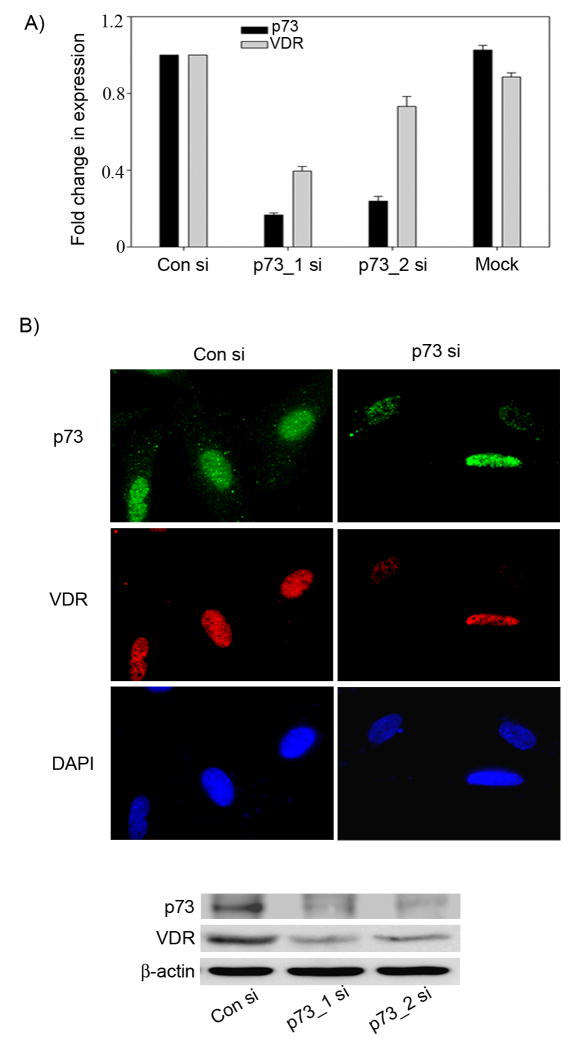
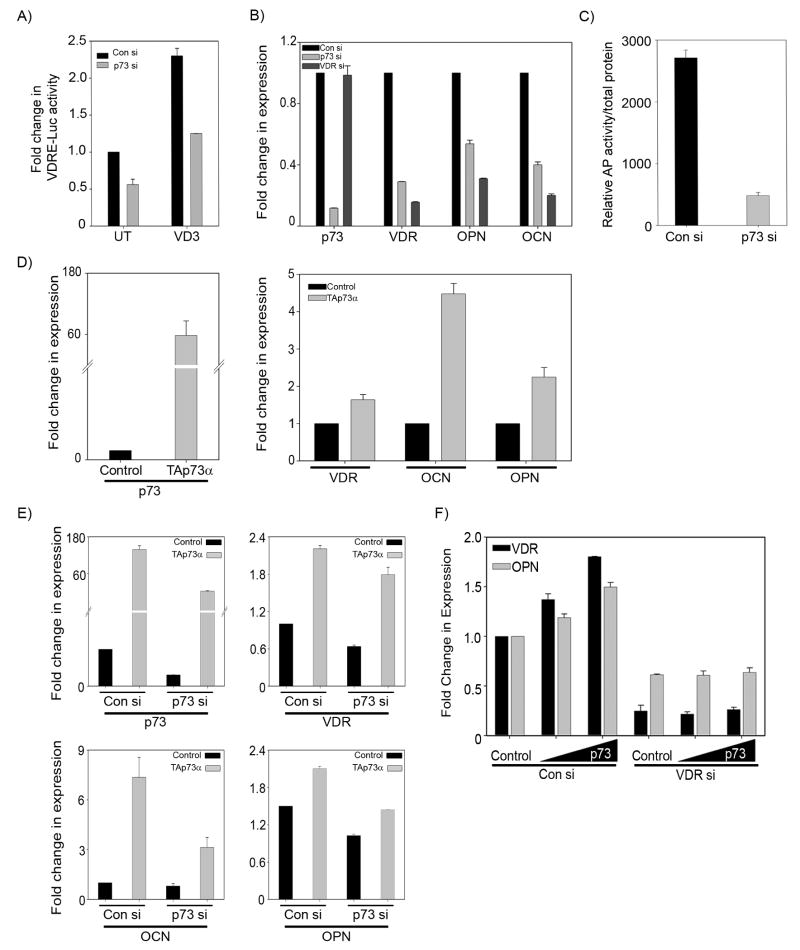
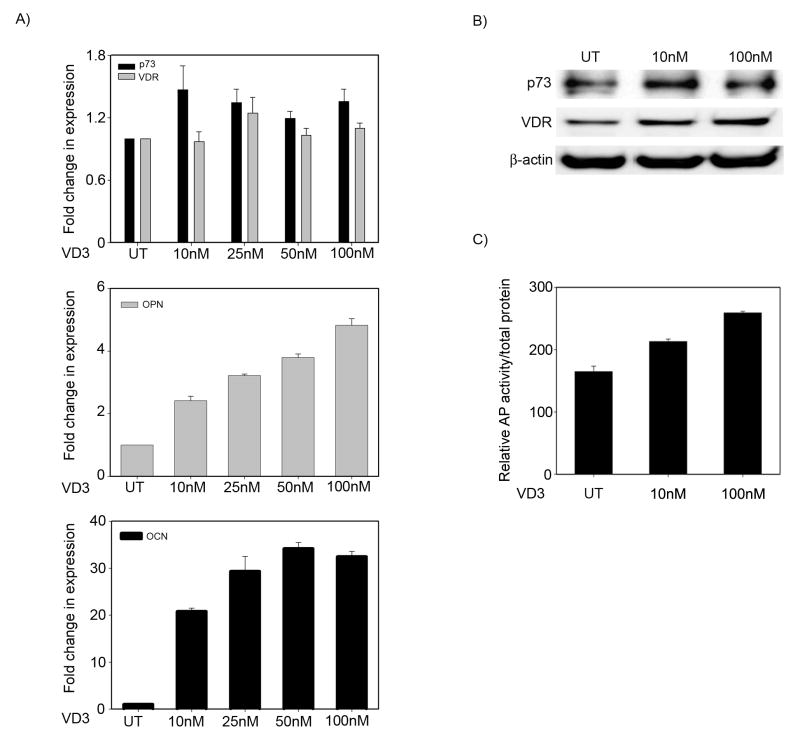
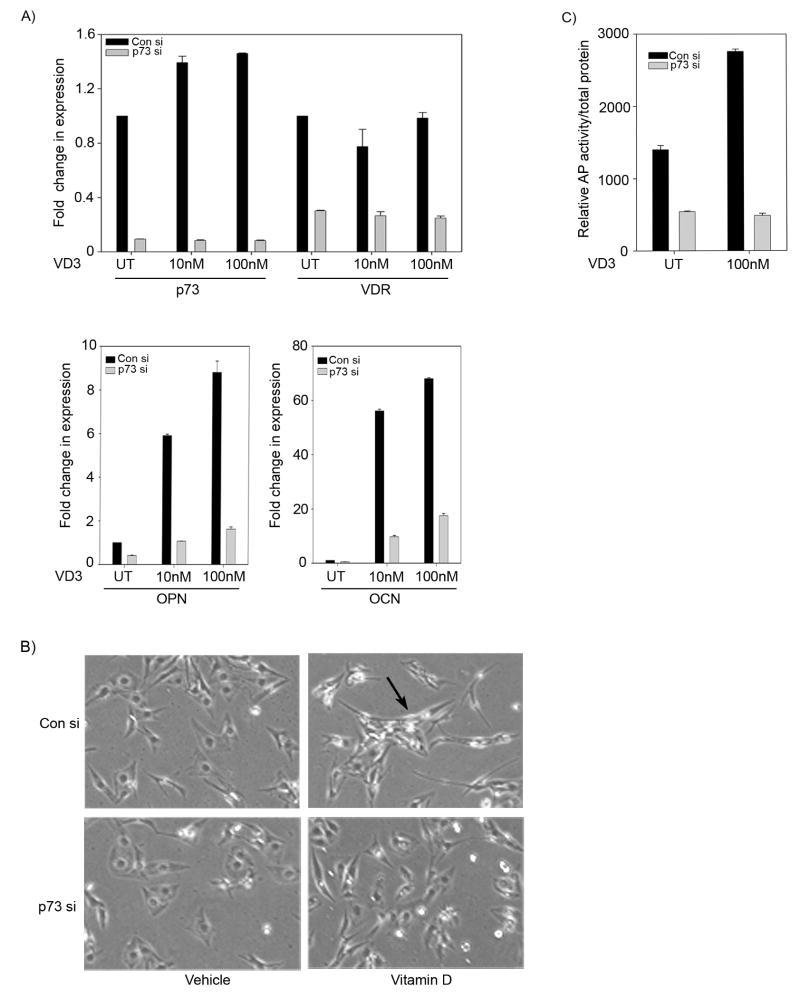
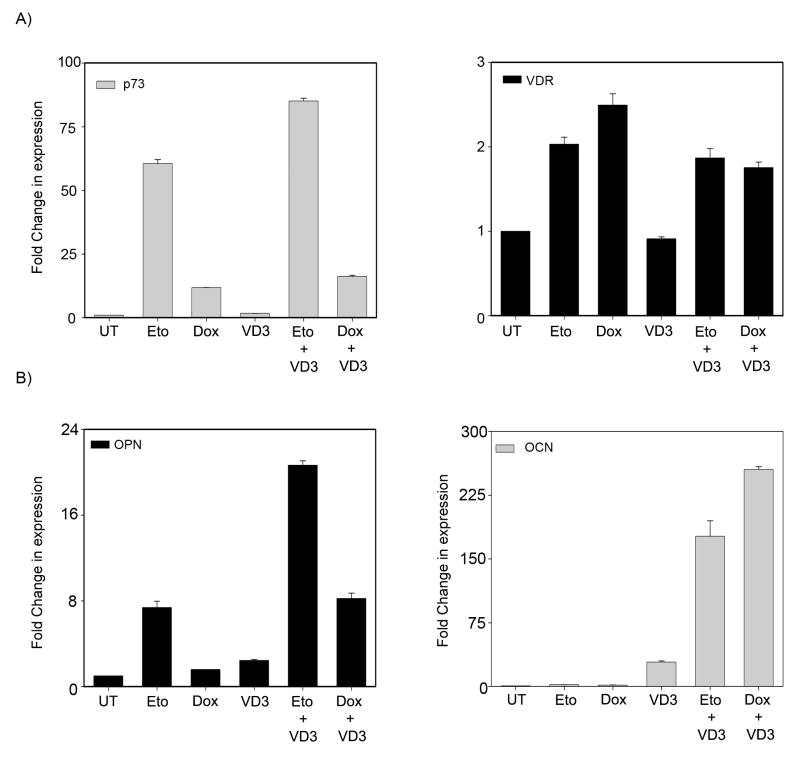
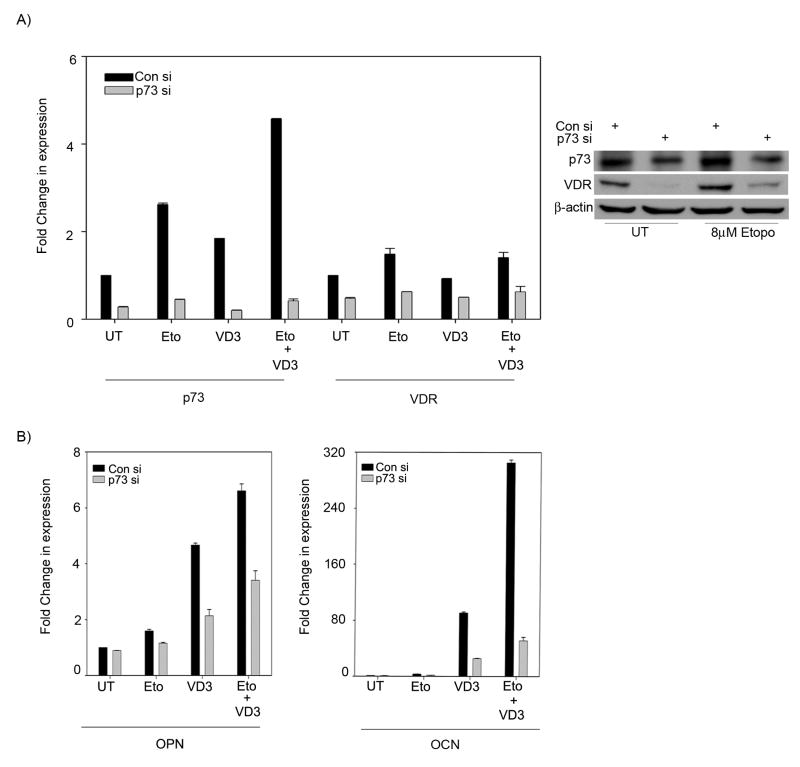
The secosteroid hormone vitamin D3 (VD3) exerts its biological actions through its cognate receptor, the vitamin D receptor (VDR). Vitamin D3 and VDR have a key function in bone formation and keratinocyte differentiation, exert antiproliferative actions in human cancer, and is widely used as a chemotherapeutic agent for cancer. In addition, VD3 promotes differentiation of human osteosarcoma cells by up-regulating genes involved in cell cycle arrest and osteoblastic differentiation. Although considerable work has been carried out in understanding the molecular mechanisms underlying the VD3-mediated differentiation of human osteosarcoma cells, the upstream regulation of VD3 signaling pathway is still unclear. In this study, we show that p73 acts as an upstream regulator of VD3-mediated osteoblastic differentiation. Transcription factor p73, a p53 homolog, has been shown to have a function in development and recently been termed as a tumor suppressor. Silencing p73 results in a significant reduction of VD3-mediated osteoblastic differentiation; although DNA damage induced p73 leads to an increase in VD3-mediated differentiation of osteosarcoma cells. Together, our data implicate a novel function for p73 in vitamin D-mediated differentiation of human osteosarcoma cells.


Figures

Figure 1
Figure 1. Silencing p73 results in reduction in VDR expression in osteosarcoma cells
A) SaOS2 cells, mock transfected or transfected with two rounds of control siRNA or p73 siRNAs were harvested for total RNA at 48 hr following second round of siRNA transfection. Y-axis represents the fold change in transcript levels of VDR and p73 in cells transfected with p73 siRNA compared to control siRNA transfected cells determined by TaqMan based real time PCR. B) SaOS2 cells were transfected with control siRNA and p73 siRNA and at 48 hr post-transfection immunofluorescence was performed to detect the localization of p73 and VDR proteins as explained in materials and methods section (upper panel). Whole cell extracts prepared from SaOS2 cells were transfected with control siRNA or p73 siRNA were subjected to immunoblot analysis using VDR and β-actin specific antibodies. p73 was detected by immunoprecipitation followed by western as described in materials and methods (lower panel).
Figure 2
Figure 2. Silencing p73 leads to a down regulation in vitamin D transcriptional activity and VDR downstream targets
A) SaOS2 cells transfected with either control siRNA or p73 siRNA were transfected with VDRE-Luc construct along with Renilla luciferase construct followed by treatment with 10 nM VD3 for 48 hr. Dual luciferase assays were performed to detect the VDRE-Luc activity and Y-axis represents the fold change in VDRE-Luc activity compared to control siRNA transfected cells treated with vehicle. Error bars represent standard deviation from the mean. B) SaOS2 cells were transfected twice with either control siRNA, p73 siRNA or VDR siRNA. Total RNA was harvested at 48 hr and subjected to TaqMan based real time PCR to detect the endogenous transcript levels of VDR, p73, OPN and OCN. Y-axis represents the fold change in transcript levels compared to control siRNA transfected cells. Error bars represent standard deviation from the mean. C) SaOS2 cells were transfected with control or p73 siRNA and after 36 hrs subjected to two freeze-thaw cycles for whole cell lysate extraction. Alkaline phosphatase activity was measured and normalized to total protein. D) SaOS2 cells were transfected with control vector or TAp73α expression plasmid and 24 hr post transfection transcript levels of p73, VDR, OCN and OPN were determined. Y-axis represents the fold change in transcript levels of p73, VDR, OCN and OPN compared to control vector transfected cells. Error bars represent standard deviation from the mean. E) SaOS2 cells were transfected twice with control siRNA and p73 siRNA and 24 hr post siRNA transfections, both control siRNA and p73 siRNA cells were transfected with either control vector or TAp73α expression plasmid as indicated. After 24 hrs total RNA was harvested for determination of p73, VDR, OCN and OPN transcript levels. Y-axis represents the fold change in transcript levels of p73, VDR, OCN and OPN compared to control vector transfected cells with control siRNA. Error bars represent standard deviation from the mean. F) SaOS2 cells transfected with control siRNA or VDR siRNA were transfected with vector control or increasing amounts of TAp73α. At 24 hr post-transfection, total RNA was extracted and TaqMan based real time PCR was performed to detect transcript levels of VDR and OPN. Y-axis represents the fold change in the transcript levels compared to control treated cells.
Figure 3
Figure 3. Vitamin D has no effect on endogenous p73 expression
A) SaOS2 cells were treated with either vehicle (UT) or increasing concentrations of VD3 as indicated. At 48 hr post-treatment, total RNA was extracted and TaqMan based real time PCR was performed to detect the transcript levels of p73 and OPN and OCN. Y-axis represents the fold change in the transcript levels compared to vehicle treated cells. Error bars represent standard deviation from the mean. B) Cells were treated with vehicle or increasing concentrations of VD3 and at 48 hr post-treatment, protein was harvested and immunoprecipitated for p73. Both immunoprecipitated and non-immunoprecipitated samples were then subjected to western blot analysis for p73, VDR, and β-actin. C) SaOS2 cells were treated with vehicle or two different concentrations of VD3. Y-axis represents the relative AP activity normalized to total protein. Error bars represent standard deviation from the mean.
Figure 4
Figure 4. p73 is required for vitamin D mediated osteoblastic differentiation
A) SaOS2 cells transfected with control siRNA or p73 siRNA were harvested and re-plated onto 6 well plates. Next day, cells were treated for 48 hr post vehicle or 10 nM or 100 nM VD3 and total RNA was extracted and transcript levels of p73, VDR, OPN and OCN were determined. Y-axis represents the fold change in transcript levels compared to control siRNA transfected cells with vehicle treatment. Error bars represent standard deviation from the mean. B) SaOS2 cells transfected with control siRNA or p73 siRNA were split and re-plated onto 6 wells. Next day, cells were treated with vehicle or 10 nM VD3 as indicated and at 48 hr post VD3 treatment morphological changes in cells were observed by phase contrast microscopy. C) SaOS2 cells were transfected with control or p73 siRNA and subsequently treated with vehicle or 100 nM VD3 for 24 hrs. Whole cell lysates were then collected and alkaline phosphatase activity was measured. Y-axis represents the relative AP activity normalized to total protein.
Figure 5
Figure 5. DNA damage enhances vitamin D mediated osteoblastic differentiation
A) SaOS2 cells were pretreated for 24 hr with 4 μM etoposide or 4 μM doxorubicin and subsequently cultured with vehicle or 10 nM VD3 for an additional 48 hr. Total RNA was extracted and transcript levels of p73 & VDR (A) and OPN & OCN (B) were determined by TaqMan based real time PCR. Y-axis represents the fold change in transcript levels compared to vehicle treated (UT) cells. Error bars represent standard deviation from the mean.
Figure 6
Figure 6. DNA damage potentiates vitamin D mediated differentiation via p73
A) SaOS2 cells were transfected with either control siRNA or p73 siRNA as indicated and treated with 4 μM etoposide or left untreated as indicated. Next day, cells were either cultured in vehicle or 10 nM VD3 for additional 48 hr as indicated. Transcript levels of p73 & VDR were determined. Total protein was extracted and subjected to immunoprecipitation for p73 detection or to standard Western blot analysis for VDR and β-actin. B) Transcript levels of OPN & OCN were determined as in (A) after siRNA, drug and VD3 treatment. Y-axis represents the fold change in transcript levels compared to control siRNA transfected cells treated with vehicle. Error bars represent standard deviation from the mean.

References

    1. Bikle DD. Vitamin D and skin cancer. J Nutr. 2004;134(12 Suppl):3472S–3478S. - PubMed
    1. Cooke NE, Haddad JG. Vitamin D binding protein (Gc-globulin) Endocr Rev. 1989;10(3):294–307. - PubMed
    1. Nezbedova P, Brtko J. 1alpha,25-dihydroxyvitamin D3 inducible transcription factor and its role in the vitamin D action. Endocr Regul. 2004;38(1):29–38. - PubMed
    1. Campbell MJ, Adorini L. The vitamin D receptor as a therapeutic target. Expert Opin Ther Targets. 2006;10(5):735–48. - PubMed
    1. Bouillon R, Eelen G, Verlinden L, Mathieu C, Carmeliet G, Verstuyf A. Vitamin D and cancer. J Steroid Biochem Mol Biol. 2006;102(1-5):156–62. - PubMed

Publication types

MeSH terms