

Conserved expression patterns predict microRNA targets
- PMID: 19779543
- PMCID: PMC2736581
- DOI: 10.1371/journal.pcbi.1000513
Conserved expression patterns predict microRNA targets
Abstract
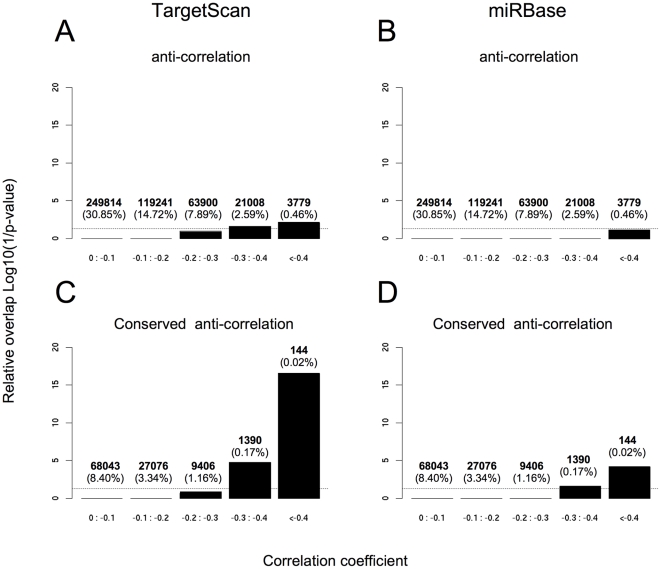
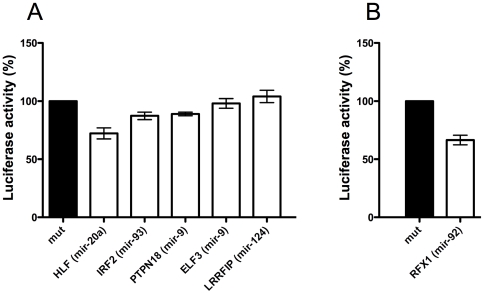
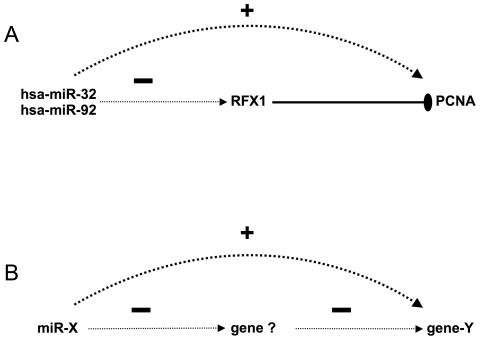
microRNAs (miRNAs) are major regulators of gene expression and thereby modulate many biological processes. Computational methods have been instrumental in understanding how miRNAs bind to mRNAs to induce their repression but have proven inaccurate. Here we describe a novel method that combines expression data from human and mouse to discover conserved patterns of expression between orthologous miRNAs and mRNA genes. This method allowed us to predict thousands of putative miRNA targets. Using the luciferase reporter assay, we confirmed 4 out of 6 of our predictions. In addition, this method predicted many miRNAs that act as expression enhancers. We show that many miRNA enhancer effects are mediated through the repression of negative transcriptional regulators and that this effect could be as common as the widely reported repression activity of miRNAs. Our findings suggest that the indirect enhancement of gene expression by miRNAs could be an important component of miRNA regulation that has been widely neglected to date.
Conflict of interest statement
The authors have declared that no competing interests exist.
Figures
Similar articles
-
Experimental Validation of MicroRNA Targets: Luciferase Reporter Assay.Methods Mol Biol. 2019;1970:315-330. doi: 10.1007/978-1-4939-9207-2_17. Methods Mol Biol. 2019. PMID: 30963500
-
Human microRNA target identification by RRSM.J Theor Biol. 2011 Oct 7;286(1):79-84. doi: 10.1016/j.jtbi.2011.06.022. Epub 2011 Jun 29. J Theor Biol. 2011. PMID: 21736879
-
Increasing MicroRNA target prediction confidence by the relative R(2) method.J Theor Biol. 2009 Aug 21;259(4):793-8. doi: 10.1016/j.jtbi.2009.05.007. Epub 2009 May 20. J Theor Biol. 2009. PMID: 19463832 Free PMC article.
-
MicroRNA (miRNA) Profiling.Methods Mol Biol. 2016;1381:151-61. doi: 10.1007/978-1-4939-3204-7_8. Methods Mol Biol. 2016. PMID: 26667459 Review.
-
Identification of cardiovascular microRNA targetomes.J Mol Cell Cardiol. 2011 Nov;51(5):674-81. doi: 10.1016/j.yjmcc.2011.08.017. Epub 2011 Aug 24. J Mol Cell Cardiol. 2011. PMID: 21888912 Review.
Cited by
-
Computing microRNA-gene interaction networks in pan-cancer using miRDriver.Sci Rep. 2022 Mar 8;12(1):3717. doi: 10.1038/s41598-022-07628-z. Sci Rep. 2022. PMID: 35260634 Free PMC article.
-
Regulation of angiogenesis by hypoxia: the role of microRNA.Cell Mol Biol Lett. 2013 Mar;18(1):47-57. doi: 10.2478/s11658-012-0037-0. Epub 2012 Nov 3. Cell Mol Biol Lett. 2013. PMID: 23124858 Free PMC article. Review.
-
Identification of nuclear-enriched miRNAs during mouse granulopoiesis.J Hematol Oncol. 2014 May 15;7:42. doi: 10.1186/1756-8722-7-42. J Hematol Oncol. 2014. PMID: 24886830 Free PMC article.
-
Identification and Insilico Analysis of Retinoblastoma Serum microRNA Profile and Gene Targets Towards Prediction of Novel Serum Biomarkers.Bioinform Biol Insights. 2013;7:21-34. doi: 10.4137/BBI.S10501. Epub 2013 Jan 9. Bioinform Biol Insights. 2013. PMID: 23400111 Free PMC article.
-
A miRNA-regulatory network explains how dysregulated miRNAs perturb oncogenic processes across diverse cancers.Genome Res. 2012 Nov;22(11):2302-14. doi: 10.1101/gr.133991.111. Epub 2012 Jun 28. Genome Res. 2012. PMID: 22745231 Free PMC article.
References
-
- Lim LP, Lau NC, Garrett-Engele P, Grimson A, Schelter JM, et al. Microarray analysis shows that some microRNAs downregulate large numbers of target mRNAs. Nature. 2005;433:769–773. - PubMed
-
- Pillai RS, Bhattacharyya SN, Filipowicz W. Repression of protein synthesis by miRNAs: how many mechanisms? Trends Cell Biol. 2007;17:118–126. - PubMed
-
- Baehrecke EH. miRNAs: micro managers of programmed cell death. Curr Biol. 2003;13:R473–475. - PubMed
-
- Brennecke J, Hipfner DR, Stark A, Russell RB, Cohen SM. bantam encodes a developmentally regulated microRNA that controls cell proliferation and regulates the proapoptotic gene hid in Drosophila. Cell. 2003;113:25–36. - PubMed
-
- Wienholds E, Plasterk RHA. MicroRNA function in animal development. FEBS Lett. 2005;579:5911–5922. - PubMed
Publication types
MeSH terms
Substances
LinkOut - more resources
Full Text Sources
