. 2009 Sep;5(9):e1000663.
doi: 10.1371/journal.pgen.1000663. Epub 2009 Sep 25.

Imprinting of the polycomb group gene MEDEA serves as a ploidy sensor in Arabidopsis

Affiliations

Imprinting of the polycomb group gene MEDEA serves as a ploidy sensor in Arabidopsis

Aleksandra Erilova et al. PLoS Genet. 2009 Sep.

Abstract

Balanced maternal and paternal genome contributions are a requirement for successful seed development. Unbalanced contributions often cause seed abortion, a phenomenon that has been termed "triploid block." Misregulation of imprinted regulatory genes has been proposed to be the underlying cause for abnormalities in growth and structure of the endosperm in seeds with deviating parental contributions. We identified a mutant forming unreduced pollen that enabled us to investigate direct effects of unbalanced parental genome contributions on seed development and to reveal the underlying molecular mechanism of dosage sensitivity. We provide evidence that parent-of-origin-specific expression of the Polycomb group (PcG) gene MEDEA is causally responsible for seed developmental aberrations in Arabidopsis seeds with increased paternal genome contributions. We propose that imprinted expression of PcG genes is an evolutionary conserved mechanism to balance parental genome contributions in embryo nourishing tissues.


Conflict of interest statement

European patent EP09008196 “Polyploid plants” was deposited by ETH on June 23rd, 2009.

Figures
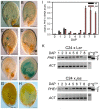
Figure 1
Figure 1. Overexpression of PHE1::GUS and the endogenous paternal PHE1 allele in seeds of jas plants.
(A,C,E,G) PHE1::GUS expression in wild-type seeds, (B,D,F,H) PHE1::GUS expression in seeds of selfed homozygous jas plants. Seeds were analyzed at 4 (A,B), 5 (C,D), 6 (E,F) and 10 DAP (G,H). Scale bars, 100 µm. (I) Quantitative RT–PCR analysis of PHE1 expression in wild-type and jas seeds. Error bars, s.e.m. (K) PHE1 imprinting is not affected in jas seeds. Allele specific PHE1 transcript levels were determined after crosses of C24 with wild-type (Ler) or jas plants . DAP; days after pollination. wt; wild type.
Figure 2
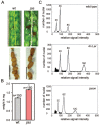
Figure 2. Homozygous jas plants produce significantly larger triploid seeds.
(A) Silique from wild-type and jas plants after self-fertilization. Triploid jas seeds are enlarged (white asterisks) and sometimes abort (dark brown seeds). Lower panels show ripe seeds. Scale bars, 0.5 mm upper panels, 1 mm lower panels. (B) Seed weight of wild-type and jas plants. Average seed weight is given in mg per 50 seeds. Significance was determined by two-tailed Student's t-test, *P<0.01. Numbers above bars indicate numbers of scored seeds per genotype. Error bars, s.e.m. (C) Representative flow cytometry histogram plots of nuclei from wild-type, tetraploid (4n) and seedlings grown from enlarged jas seeds.
Figure 3
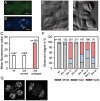
Figure 3. Homozygous jas plants form dyads and enlarged diploid pollen.
(A) Pollen from jas plants was mixed with wild-type pollen marked by the sperm cell marker MGH3::H2B-GFP . GFP negative enlarged pollen grain is derived from jas plants. Scale bar, 10 µm. (B) DAPI staining of pollen shown in panel (A). Enlarged jas pollen contains two sperm nuclei (sn) and one vegetative nucleus (vn). (C) DNA content of sperm cells in mature pollen from wild type and jas plants. Bars show mean relative DNA contents (DAPI fluorescence values) for pollen from wild type (WT) or jas plants, with jas pollen classified on the basis of size; normal sized (jas) or enlarged (jas enlarged). The mean fluorescence from the enlarged pollen was approximately twice that of the wild type and normal sized jas pollen, indicating that it has twice the DNA content. wt; wild type. (D) Tetrad formation in wild-type plants. Scale bar, 25 µm. (E) Dyad formation in jas plants. Scale bar, 25 µm. Scale bar, 10 µm. (F) Quantification of meiotic products in Ler wild-type, jas-1/+, jas-1/−, jas-3/+, jas-3/−, jas-1/jas-3 and jas-4/−. Numbers on top of columns indicate numbers of analyzed meiotic products. Triads observed in wild type are most likely caused by spore superposition. (G) Chromosomal spreads of wild-type tetrad (left panel) and jas dyad (right panel). Chromosomes are marked by arrow heads.
Figure 4
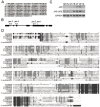
Figure 4. Structure of JAS gene and location of mutations.
(A) Protein sequence of JAS with site of jas-1 mutation indicated in red. (B) Exon-intron structure of JAS locus, with exons marked by black boxes, introns by black lines. Positions of jas alleles are indicated. (C) Expression analysis of JAS and JAS_LIKE in different plant organs. SE, seedlings; RL, rosette leaves; ST, stem; FB, floral buds (stage 9 flower); CF, closed flower (stage 11 flower); OF, open flower (stage 13 flower); SI, silique. Flower stages were determined as described in . (D) Multiple sequence alignment showing regions of highest sequence conservation among plant JAS proteins. Dark grey and light gray shading symbolizes 100% and over 50% sequence conservation at that position, respectively. Included in the alignment are JAS homologs from dicots Arabidopsis thaliana and Populus trichocarpa, from monocots Oryza sativa and Zea mays and from the lycophyte Selaginella moellendorffii.
Figure 5
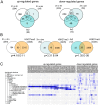
Figure 5. Transcriptome profiles of triploid seeds derived from jas and tetraploid pollen parents and fis2 mutants.
(A) Venn diagrams of up-regulated and down-regulated genes in seeds at 6DAP derived from crosses of wild-type plants with pollen from either jas plants or tetraploid plants as well as manually self-pollinated fis2 mutants. Numbers in parenthesis represent total numbers of up-regulated and down-regulated genes in the respective genotypes. (B) Venn diagrams of up-regulated genes in seeds at 6DAP derived from crosses of wild-type plants with pollen from either jas plants or tetraploid plants as well as manually self-pollinated fis2 mutants and genes marked by H3K27me3 . p-values in (A) and (B) are based on the hypergeometric test. (C) Organ-specific expression profiles of up- and down-regulated genes were extracted from publicly available microarray data .
Figure 6
Figure 6. Increased expression of FIS target genes and decreased MEA mRNA levels in triploid seeds.
Quantitative RT–PCR analysis of MEO (A) and AGL62 (B) expression in wild-type and jas seeds. Error bars, s.e.m. (C) Quantitative RT-PCR analysis of MEA expression in wild-type and jas seeds. Error bars, s.e.m. (D) Allele-specific MEA transcript levels were determined after crosses of RLD with wild type (Ler) or jas plants. Quantified results are shown in lower panel. (E) Quantitative RT-PCR analysis of FIS2 expression in wild-type and jas seeds. Error bars, s.e.m. (F) Allele-specific FIS2 transcript levels were determined after crosses of C24 with wild type (Ler) or jas plants. DAP; days after pollination. wt; wild type.
Figure 7
Figure 7. Overexpression of MEA partially complements developmental defects of triploid seeds.
(A) Quantitative RT–PCR analysis of MEA expression in seeds of wild type, jas and transgenic lines jas; RPS5::MEA/+ at 7 DAP. Error bars, s.e.m. (B) Number of enlarged seeds in wild-type, jas and transgenic lines jas; RPS5::MEA/+. Significance was determined by Chi-square test comparing normal and enlarged seeds of jas and transgenic lines. **P<0.001, *P<0.01, 1 d.f. Numbers above bars indicate numbers of scored seeds per genotype. (C) Distribution of seed developmental stages in jas and transgenic lines jas; RPS5::MEA/+ determined at 10 DAP. Numbers above bars indicate numbers of scored seeds per genotype. (D) Progression of embryo development in jas;RPS5a::MEA lines. Images correspond to developmental stages quantified in (C). Scale bars, 100 µm. (E) Quantitative RT-PCR analysis of PHE1 expression in seeds of wild-type, jas and transgenic lines jas; RPS5::MEA/+ at 7 DAP. Error bars, s.e.m. Significance was determined by two-tailed Student's t-test. **P<0.001, *P<0.01. DAP; days after pollination. wt; wild type.

Similar articles

Cited by

References

    1. Otto SP, Whitton J. Polyploid incidence and evolution. Annu Rev Genet. 2000;34:401–437. - PubMed
    1. Comai L. The advantages and disadvantages of being polyploid. Nat Rev Genet. 2005;6:836–846. - PubMed
    1. Hegarty MJ, Hiscock SJ. Genomic clues to the evolutionary success of polyploid plants. Curr Biol. 2008;18:R435–44. - PubMed
    1. Ramsey S, Schemske D. Pathways, Mechanisms, and rates of polyploid formation in flowering plants. Auual Reviews Ecology and Systematics. 1998;29:467–501.
    1. Rieseberg LH, Willis JH. Plant speciation. Science. 2007;317:910–914. - PMC - PubMed

Publication types

MeSH terms