. 2009 Sep;5(9):e1000520.
doi: 10.1371/journal.pcbi.1000520. Epub 2009 Sep 25.

Bayesian phylogeography finds its roots

Affiliations

Bayesian phylogeography finds its roots

Philippe Lemey et al. PLoS Comput Biol. 2009 Sep.

Abstract

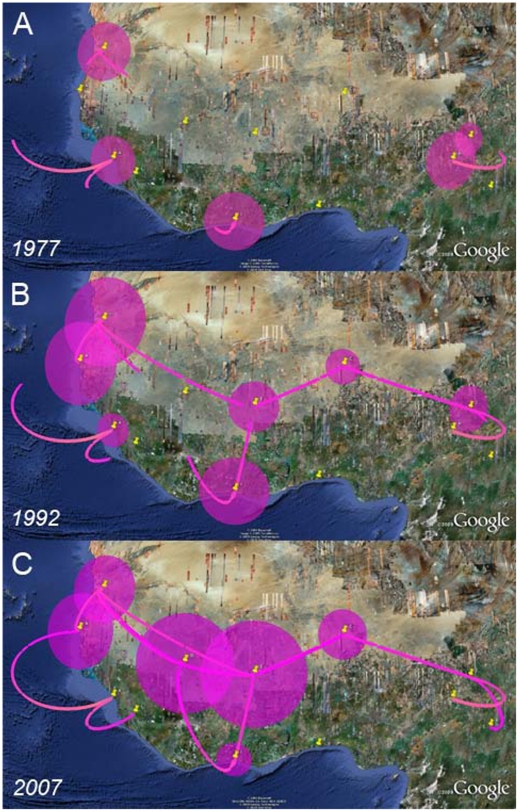
As a key factor in endemic and epidemic dynamics, the geographical distribution of viruses has been frequently interpreted in the light of their genetic histories. Unfortunately, inference of historical dispersal or migration patterns of viruses has mainly been restricted to model-free heuristic approaches that provide little insight into the temporal setting of the spatial dynamics. The introduction of probabilistic models of evolution, however, offers unique opportunities to engage in this statistical endeavor. Here we introduce a Bayesian framework for inference, visualization and hypothesis testing of phylogeographic history. By implementing character mapping in a Bayesian software that samples time-scaled phylogenies, we enable the reconstruction of timed viral dispersal patterns while accommodating phylogenetic uncertainty. Standard Markov model inference is extended with a stochastic search variable selection procedure that identifies the parsimonious descriptions of the diffusion process. In addition, we propose priors that can incorporate geographical sampling distributions or characterize alternative hypotheses about the spatial dynamics. To visualize the spatial and temporal information, we summarize inferences using virtual globe software. We describe how Bayesian phylogeography compares with previous parsimony analysis in the investigation of the influenza A H5N1 origin and H5N1 epidemiological linkage among sampling localities. Analysis of rabies in West African dog populations reveals how virus diffusion may enable endemic maintenance through continuous epidemic cycles. From these analyses, we conclude that our phylogeographic framework will make an important asset in molecular epidemiology that can be easily generalized to infer biogeogeography from genetic data for many organisms.


Conflict of interest statement

The authors have declared that no competing interests exist.

Figures

Figure 1
Figure 1. Maximum clade credibility (MCC) phylogenies for hemagglutinin (HA) and neuraminidase (NA) genes of Avian influenza A-H5N1.
We color branches according to the most probable location state of their descendent nodes. We use the same color coding as . To the upper left of both phylogenies are their root location state posterior probability distributions. A white arrow indicates the A/goose/Guangdong/1/96 sequence; a filled white circle identifies the most recent common ancestor of the Gs/GD lineage named after this strain.
Figure 2
Figure 2. Posterior location probabilities at two different nodes, the root and GsGD MRCA, for different Bayesian phylogeographic analyses of Avian influenza A-H5N1 HA and NA.
The posterior probabilities are shown for different expectations, formula image, for the gamma priors on the rates; either formula image, where formula image is an arbitrary constant, or formula image, where formula image is the distance between location formula image and formula image. A truncated Poisson (TP) prior with formula image was used in the Bayesian stochastic search variable selection (BSSVS) procedure.
Figure 3
Figure 3. Bayes factor (BF) test for significant non-zero rates in Avian influenza A-H5N1.
Only rates supported by a BF greater than 3 are indicated. The color and thickness of the line represent the relative strength by which the rates are supported; thin white lines and thick red lines suggest relatively weak and strong support respectively. The maps are based on satellite pictures made available in Google Earth (http://earth.google.com).
Figure 4
Figure 4. Bayes factor test for significant non-zero rates for the combined HA and NA analysis.
Only rates supported by a BF greater than 3 are indicated. The color and thickness of the line represent the relative strength by which the rates are supported; thin white lines and thick red lines suggest relatively weak and strong support respectively. The maps are based on satellite pictures made available in Google Earth (http://earth.google.com).
Figure 5
Figure 5. Temporal dynamics of spatial Avian influenza A-H5N1 diffusion.
We provide snapshots of the dispersal pattern for May 1997, 2001, 2003 and 2005. Lines between locations represent branches in the MCC tree along which the relevant location transition occurs. Location circle diameters are proportional to square root of the number of MCC branches maintaining a particular location state at each time-point. The white-green and yellow-magenta color gradients inform the relative age of the transitions for HA and NA respectively (older-recent). The maps are based on satellite pictures made available in Google Earth (http://earth.google.com).
Figure 6
Figure 6. Inferred phylogeny, demographic history and root location for Africa rabies virus.
(A) MCC phylogeny with branches colored according to the most probable posterior location of their child nodes; superimposed under the phylogeny lies the inferred demographic history. (B) Root location posterior probabilities are shown for the standard discrete model (opaque) and for the BSSVS extension with, in addition, distance-informed priors on the infinitesimal migration rates (transparent). The distance-informed priors in the latter had little impact on the results (data not shown). Both the height and width of the cylinders are proportional to root location posterior probability; the same colors as the tree branches in (A) are used. The maps are based on satellite pictures made available in Google Earth (http://earth.google.com.).
Figure 7
Figure 7. Inferred migration graph for African rabies virus and its reflection of the events reconstructed from the MCC tree.
(A) Significantly non-zero migration rate using a Bayes factor test. Line thicknesses and the white-red color gradient relate to relative posterior migration rate expectations. (B) Projection of reconstructed migration events. Link heights indicate the relative durations of the branches upon which the inferred migration occurs, while the yellow-magenta color gradient informs the relative age of the transition (older-recent). The maps are based on satellite pictures made available in Google Earth (http://earth.google.com).
Figure 8
Figure 8. West African dog rabies virus migration over the last three decades.
The different panels represent temporal projections of reconstructed migration events every 15 years: A) 1977, B) 1992 and C) 2007. In these projections, each MCC branch is again translated into a geographic link that connects the branch's most probable starting and ending location states. The panels only show migration events or partial migration events that have occurred up to a particular date, assuming that the virus migrates at a constant rate over the inferred time span of the branch. The maps are based on satellite pictures made available in Google Earth (http://earth.google.com).

References

    1. Holmes E. The phylogeography of human viruses. Molecular Ecology. 2004;13:745–756. - PubMed
    1. Rambaut A, Pybus O, Nelson M, Viboud C, Taubennerger J, et al. The genomic and epidemiological dynamics of human influenza A virus. Nature. 2008;453:615–619. - PMC - PubMed
    1. Russell CA, Jones TC, Barr IG, Cox NJ, Garten RJ, et al. The global circulation of seasonal influenza A (H3N2) viruses. Science. 2008;320:340–346. - PubMed
    1. Wallace RG, Fitch WM. Influenza A H5N1 immigration is filtered out at some international borders. PLoS ONE. 2008;3:e1697. - PMC - PubMed
    1. Olsen SJ, Chang HL, Cheung TYY, Tang AFY, Fisk TL, et al. Transmission of the severe acute respiratory syndrome on aircraft. N Engl J Med. 2003;349:2416–2422. - PubMed

Publication types