. 2009 Nov;62(5):1242-50.
doi: 10.1002/mrm.22118.

Maximum linear-phase spectral-spatial radiofrequency pulses for fat-suppressed proton resonance frequency-shift MR Thermometry

Affiliations

Maximum linear-phase spectral-spatial radiofrequency pulses for fat-suppressed proton resonance frequency-shift MR Thermometry

William A Grissom et al. Magn Reson Med. 2009 Nov.

Abstract

Conventional spectral-spatial pulses used for water-selective excitation in proton resonance frequency-shift MR thermometry require increased sequence length compared to shorter wideband pulses. This is because spectral-spatial pulses are longer than wideband pulses, and the echo time period starts midway through them. Therefore, for a fixed echo time, one must increase sequence length to accommodate conventional spectral-spatial pulses in proton resonance frequency-shift thermometry. We introduce improved water-selective spectral-spatial pulses for which the echo time period starts near the beginning of excitation. Instead of requiring increased sequence length, these pulses extend into the long echo time periods common to PRF sequences. The new pulses therefore alleviate the traditional tradeoff between sequence length and fat suppression. We experimentally demonstrate an 11% improvement in frame rate in a proton resonance frequency imaging sequence compared to conventional spectral-spatial excitation. We also introduce a novel spectral-spatial pulse design technique that is a hybrid of previous model- and filter-based techniques and that inherits advantages from both. We experimentally validate the pulses' performance in suppressing lipid signal and in reducing sequence length compared to conventional spectral-spatial pulses.


Figures

Figure 1
Figure 1
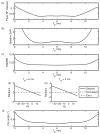
Dependence of (a) peak B1, (b) SAR relative to a linear-phase pulse, and (c) normalized RMS excitation error (NRMSE) on the TE period starting time Ttd. The metrics generally increase when Ttd is shorter or longer than half the pulse’s duration. However, they all remain within reasonable values over a large range of Ttd values. (d,e) The excited phase across the water band (z = 0 cm plotted) does not deviate significantly from the desired phase even for the most extreme Ttd values. (f) The peak fat flip angle, for a 30° water excitation, increases as one moves away from a linear-phase pulse, though it remains small for all values of Ttd.
Figure 2
Figure 2
Maximum linear-phase SPSP pulse for 1.5T. The peak RF magnitude of 0.075 G is reached near the beginning of the pulse. This reflects the early point in time at which the TE period starts, which is indicated by the dashed vertical line at 1.13 ms.
Figure 3
Figure 3
Simulated (a,c) and experimental (b,d) magnitude and phase of the 1.5T pulse’s excitation pattern. The pulse produces no excitation in the fat band, and a 1 cm slice in water band. From the experimental data, we measured Ttd = 1.04 ms via a linear fit to the excitation phase in the water band, which is close to the desired 1.13 ms. We also measured a FWHM of 0.968 cm, which matches the simulated FWHM.
Figure 4
Figure 4
(a–c) Simulated and (d–f) experimental excitation profiles. (a,d) Slice profiles at f = 0 Hz, with pass- and stop-band ripple bounds indicated in the simulated profile (dashed lines). Spectral magnitude (b,e) and phase (c,f) profiles at z = 0 cm, with phase error indicated in (c,f) (dashed lines).
Figure 5
Figure 5
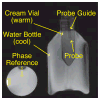
Image of the experimental setup prior to heating, using the maximum linear-phase pulse for excitation.
Figure 6
Figure 6
Temperature during cooling using (a) sinc and (b) maximum linear-phase excitation, measured at the tip of the fiber-optic probe (indicated by the ‘Probe’ arrow in Fig. 5). Fat and water nominally accrue π phase difference between the two echo times. (a) Without fat suppression, the measured temperature is highly inaccurate, and is dependent on the relative phase between fat and water. (b) With the maximum linear-phase pulse, the measured temperature accurately tracks the temperature recorded with the fiber optic probe, regardless of the fat/water phase relationship.
Figure 7
Figure 7
Magnitude image acquired prior to heating and a phase image acquired during heating, using the maximum linear-phase pulse for excitation. The black arrow indicates the location of the hot spot, which is visible in the phase image. The white arrow indicates the location of the oil-filled vial, validating fat suppression.
Figure 8
Figure 8
Phase change relative to baseline in the central voxel of the hot spot during heating. The phase differences match very well between the two pulses, indicating equivalent temperature sensitivity despite the shorter duration of the maximum linear-phase pulse’s sequence.

References

    1. Rieke V, Pauly KB. Echo combination to reduce proton resonance frequency (PRF) thermometry errors from fat. J Magn Reson Imaging. 2008;27(3):673–677. - PMC - PubMed
    1. Meyer CH, Pauly JM, Macovski A, Nishimura DG. Simultaneous spatial and spectral selective excitation. Magn Reson Med. 1990 Aug;15(2):287–304. - PubMed
    1. de Zwart JA, Vimeux FC, Delalande C, Canioni P, Moonen CT. Fast lipid-suppressed MR temperature mapping with echo-shifted gradient-echo imaging and spectral-spatial excitation. Magn Reson Med. 1999;42(1):53–59. - PubMed
    1. Weidensteiner C, Quesson B, Caire-Gana B, Kerioui N, Rullier A, Trillaud H, Moonen CTW. Real-time MR temperature mapping of rabbit liver in vivo during thermal ablation. Magn Reson Med. 2003;50(2):322–330. - PubMed
    1. Zur Y. Design of improved spectral-spatial pulses for routine clinical use. Magn Reson Med. 2000 Mar;43(3):410–420. - PubMed

Publication types

MeSH terms