. 2009 Sep 25:2:195.
doi: 10.1186/1756-0500-2-195.

Parallel changes in gene expression in peripheral blood mononuclear cells and the brain after maternal separation in the mouse

Affiliations

Parallel changes in gene expression in peripheral blood mononuclear cells and the brain after maternal separation in the mouse

Johan H van Heerden et al. BMC Res Notes. .

Abstract

Background: The functional integration of the neuro-, endocrine- and immune-systems suggests that the transcriptome of white blood cells may reflect neuropsychiatric states, and be used as a non-invasive diagnostic indicator. We used a mouse maternal separation model, a paradigm of early adversity, to test the hypothesis that transcriptional changes in peripheral blood mononuclear cells (PBMCs) are paralleled by specific gene expression changes in prefrontal cortex (PFC), hippocampus (Hic) and hypothalamus (Hyp). Furthermore, we evaluated whether gene expression profiles of PBMCs could be used to predict the separation status of individual animals.

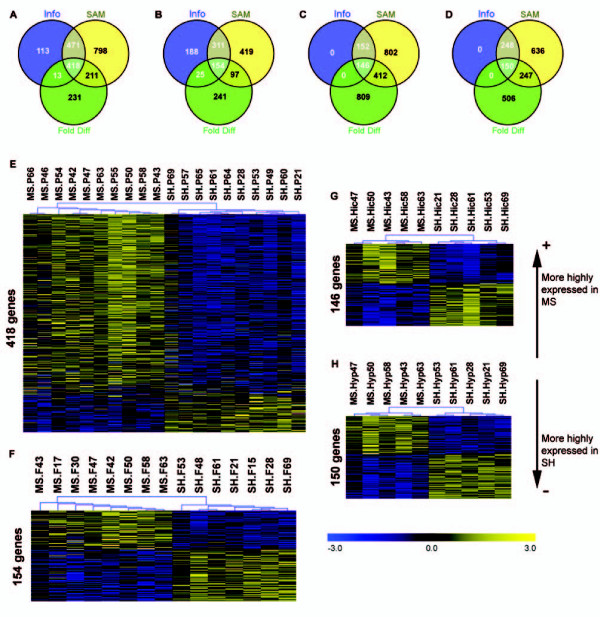
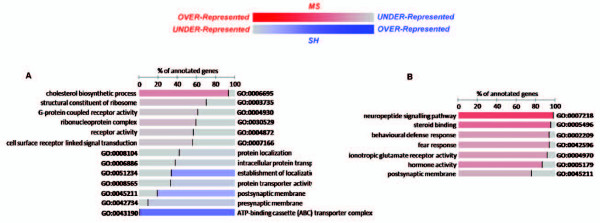
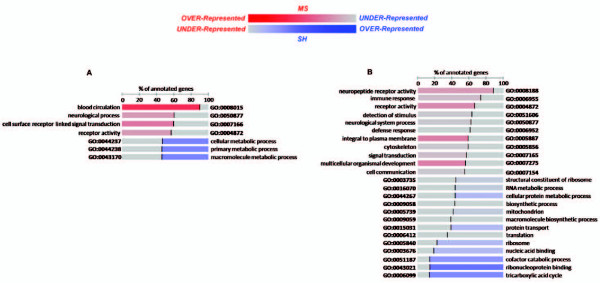
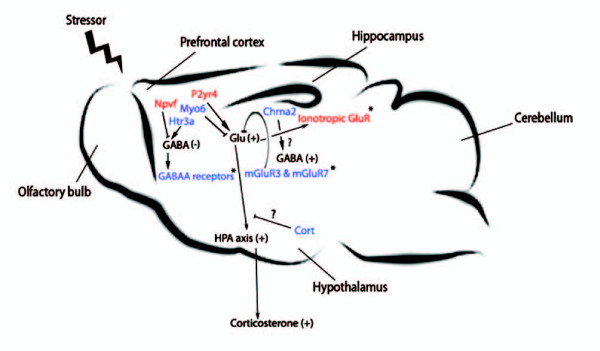
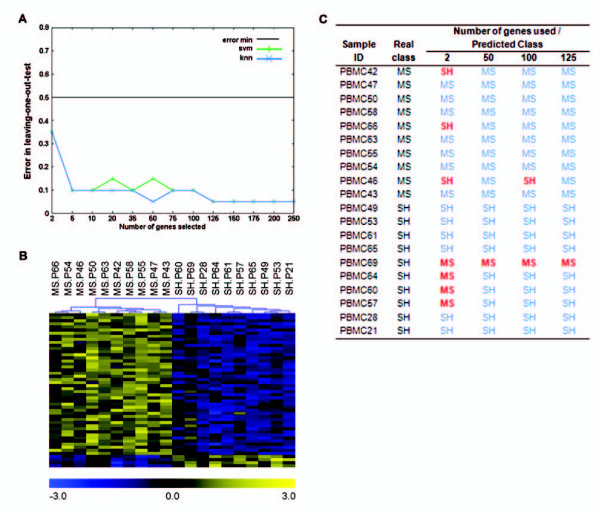
Findings: Microarray gene expression profiles of all three brain regions provided substantial evidence of stress-related neural differences between maternally separated and control animals. For example, changes in expression of genes involved in the glutamatergic and GABAergic systems were identified in the PFC and Hic, supporting a stress-related hyperglutamatergic state within the separated group. The expression of 50 genes selected from the PBMC microarray data provided sufficient information to predict treatment classes with 95% accuracy. Importantly, stress-related transcriptome differences in PBMC populations were paralleled by stress-related gene expression changes in CNS target tissues.

Conclusion: These results confirm that the transcriptional profiles of peripheral immune tissues occur in parallel to changes in the brain and contain sufficient information for the efficient diagnostic prediction of stress-related neural states in mice. Future studies will need to evaluate the relevance of the predictor set of 50 genes within clinical settings, specifically within a context of stress-related disorders.


Figures

Figure 1
Figure 1
Differential gene expression results. Venn diagrams show the overlap between different gene selection criteria (Info and SAM P < 0.05 and Fold difference > 1.2) for (A) PBMC, (B) pFC, (C) Hic and (D) Hyp. This gene selection strategy significantly reduced the number of genes identified as DE by any one single criterion. Also shown are the false colour sample profiles of hierarchically clustered differentially expressed genes for (E) PBMC samples [347 over- and 71 under-expressed], and neural tissues (F) pFC [66 over- and 88 under-expressed], (G) Hic [71 over- and 75 under-expressed] and (H) Hyp [69 over- and 81 under-expressed]. The selected genes produce a clear separation between MS and SH samples. Genes more highly expressed in MS samples are at the top and those more highly expressed in SH samples at the bottom. P = PBMC; F = pFC.
Figure 2
Figure 2
FatiScan gene set enrichment results. Shown are significant co-ordinately expressed GO terms within whole gene sets for (A) PFC and (B) Hic. The normalized percentage of genes annotated with a specific term is indicated for each group. Red indicates coordinated over-expression in MS group and Blue coordinated over-expression SH group (or under-expression in MS group). Colour intensity denotes how strongly a term is over- or under-expressed.
Figure 3
Figure 3
FatiScan gene set enrichment results. Shown are significant co-ordinately expressed GO terms within whole gene sets for (A) Hyp and (B) PBMC. The normalized percentage of genes annotated with a specific term is indicated for each group. Red indicates coordinated over-expression in MS group and Blue coordinated over-expression SH group (or under-expression in MS group). Colour intensity denotes how strongly a term is over- or under-expressed.
Figure 4
Figure 4
Schematic summary of neural gene expression results in support of a stress-related hyperglutamatergic state in MS brain samples. Such a hyperglutamaterigc state could potentially result in elevated stress-induced corticosterone responses. Red indicates over-expression and blue under-expression, in MS samples, respectively. An asterisk indicates genes or functional classes that were found to be regulated in a coordinated manner. Glu = Glutamate, (+) indicates increased signalling activity, (-) indicates decreased signalling/acitivity.
Figure 5
Figure 5
Sample classification and prediction results. (A) Leave-one-out error rates of classifiers. The KNN algorithm (blue line) reaches an optimal prediction efficiency of 95% with a minimum of 50 genes. Using 125 genes the SVM algorithm (green line) obtains this efficiency, and converges with KNN. (B) Hierarchically sample clustered (Pearson correlation metric with average linkage) profiles for the 50 gene predictor set. Notice, that although only 19 out of 20 samples were correctly classified, hierarchical clustering separates all samples into two general treatment-related clusters. (C) A summary of KNN sample classification results, showing details of the misclassification of individual samples. Although most samples classes were correctly predicted, PBMC69, an SH sample, was consistently misclassified. P = PBMC.

References

    1. Segman RH, Shefi N, Goltser-Dubner T, Friedman N, Kaminski N, Shalev AY. Peripheral blood mononuclear cell gene expression profiles identify emergent post-traumatic stress disorder among trauma survivors. Mol Psychiatry. 2005;10:500–513. doi: 10.1038/sj.mp.4001636. - DOI - PubMed
    1. Tsuang MT, Nossova N, Yager T, Tsuang MM, Guo SC, Shyu KG, Glatt SJ, Liew CC. Assessing the validity of blood-based gene expression profiles for the classification of schizophrenia and bipolar disorder: a preliminary report. Am J Med Genet B Neuropsychiatr Genet. 2005;133B:1–5. doi: 10.1002/ajmg.b.30161. - DOI - PubMed
    1. Besedovsky HO, del Rey A. Immune-neuro-endocrine interactions: facts and hypotheses. Endocr Rev. 1996;17:64–102. - PubMed
    1. Tang Y, Lu A, Aronow BJ, Sharp FR. Blood genomic responses differ after stroke, seizures, hypoglycemia, and hypoxia: blood genomic fingerprints of disease. Ann Neurol. 2001;50:699–707. doi: 10.1002/ana.10042. - DOI - PubMed
    1. Meaney MJ, Szyf M. Maternal care as a model for experience-dependent chromatin plasticity? Trends in Neurosciences. 2005;28:456–463. doi: 10.1016/j.tins.2005.07.006. - DOI - PubMed

LinkOut - more resources