. 2009 Dec;201(2):121-30.
doi: 10.1016/j.jmr.2009.08.012. Epub 2009 Sep 2.

Labeling strategies for 13C-detected aligned-sample solid-state NMR of proteins

Affiliations

Labeling strategies for 13C-detected aligned-sample solid-state NMR of proteins

Fabian V Filipp et al. J Magn Reson. 2009 Dec.

Abstract

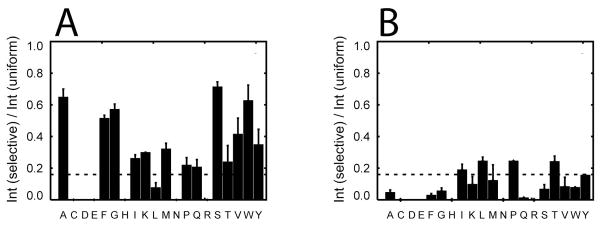
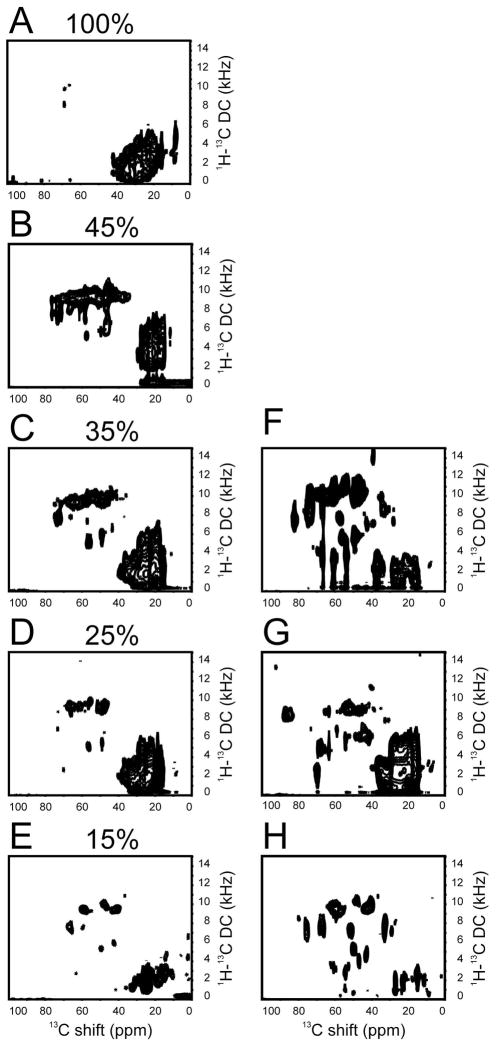
(13)C-detected solid-state NMR experiments have substantially higher sensitivity than the corresponding (15)N-detected experiments on stationary, aligned samples of isotopically labeled proteins. Several methods for tailoring the isotopic labeling are described that result in spatially isolated (13)C sites so that dipole-dipole couplings among the (13)C are minimized, thus eliminating the need for homonuclear (13)C-(13)C decoupling in either indirect or direct dimensions of one- or multi-dimensional NMR experiments that employ (13)C detection. The optimal percentage for random fractional (13)C labeling is between 25% and 35%. Specifically labeled glycerol and glucose can be used at the carbon sources to tailor the isotopic labeling, and the choice depends on the resonances of interest for a particular study. For investigations of the protein backbone, growth of the bacteria on [2-(13)C]-glucose-containing media was found to be most effective.


Figures

Figure 1
Figure 1
Analysis of fractional uniform 13C labeling at the Cα sites in the polypeptide backbone. A. Schematic chemical structure of an isolated 13Cα site bonded only to 12C that would contribute a high resolution NMR signal. B. Schematic chemical structure of a non-isolated 13Cα site bonded to 13Cβ and/or 13CO sites that would contribute a broadened or undetectable NMR signal. C. Schematic chemical structure of an unlabeled 12Cα site that would not contribute a signal. D. The probability (p) of occurrence of an isolated 13 sitesCαthat would contribute high resolution NMR signals is predicted by the function f(p) = p(1-p)2. The arrows denote the experimentally tested labeling ratios of 15%, 25%, 35%, and 45%.
Figure 2
Figure 2
Analysis of 13C labeling patterns of proteins obtained from E. coli by solution NMR of fd coat protein in micelles. A. and B. are one-dimensional direct-detected 13C NMR spectra obtained by direct excitation. A. The protein was obtained from bacteria grown on 25% uniformly 13C labeled media. B. The protein was obtained from bacteria grown on 2–13C glucose-containing media. C. Overlay of two-dimensional 13CO-edited 1H/15N correlation spectra of the proteins whose spectra are shown in panels A. and B. Grey indicates 25% uniformly labeled with 13C and black indicates labeled by growth on [2-13C]-glucose containing media.
Figure 3
Figure 3
Analysis of 13C labeling using 13C-edited two-dimensional 1H/15N correlation spectra. Left column: Topology of 13C labeling (black) from a sample obtained from bacteria grown on [2-13C] containing media. A. Isoleucine 22 linked to glycine 23. B. Lysine 40 linked to leucine 41. C. Leucine 41 linked to phenylalanine 42. Right column: Experimental two-dimensional 1H/15N projections of three-dimensional HNCO, HNCA, HNCOCA protein backbone spectra. Spectra from the sample obtained by growth on [2-13C] glucose containing media (thick lines) is compared with a [25 % uniformly 13C labelled sample (thin dashed lines).
Figure 4
Figure 4
Experimentally observed 13C labeling of fd coat protein obtained from E. coli grown on [2-13C]-glucose-containing media as measured from intensities in 1H-13C projections of HNCO and HNCA spectra. A. Ca sites. B. CO sites. The dashed lines mark 18% labeling, which is the level used to designate those sites that are likely to provide observable signals in solid-state NMR experiments.
Figure 5
Figure 5
Comparison of NMR spectra of 100% uniformly 15N labelled and fractional uniformly 13C labelled samples of Pf1 coat protein obtained from P. aeruginosa. Column A: 15N-edited 1H solution NMR spectra of the protein in micelles. Column B: Direct-detected solution 13C NMR spectra obtained by direct-excitation of the protein in micelles. Column C: 13C-detected cross-polarization solid-state NMR spectra obtained with both {1H} and {15N} decoupling during acquisition. D. 100% uniformly 13C labelled. E. 45% uniformly 13C labelled. F. 25% uniformly 13C labelled. G. From growth on 2–13C glycerol-containing media. H. From growth on 1, 3 13C glycerol-containing media. I. From growth on 2–13C-glucose containing media
Figure 6
Figure 6
Experimentally observed 13C labeling at the Pf1 coat protein obtained from P. aeruginosa grown on three different types of 13C-containing media. The intensity ratios are measured from 1H,13C-projections of HNCO and HNCA spectra compared to those from a 100% uniformly 13C sample. A. Cα sites of a 25 % uniformly 3C labeled protein sample. The dashed line marks 25% labeling. B. Cα sites of a protein sample obtained from growth on [2-13C]-glucose containing media. C. Co sites of a protein sample obtained from growth on [2-13C]-glucose containing media. In B. and C. the dashed lines marek 18% labeling, as in Figure 4.
Figure 7
Figure 7
Amino acids with isolated Cα sites in the polypeptide backbone with > 18% labeling. The amino acids present in Pf1 coat protein are marked by asterisks; for those amino acids that do not occur in the protein, the labeling anticipated from the Entner-Doudoroff pathway is included for completeness. The presence or absence of significant 13C labeling in the Cα, Cβ, and CO sites of the specified amino acids is designated in the horizontal rows. If the labeling at a Cα site is > 18% and the labeling at the bonded Cβ and CO sites is < 18%, then the Cα site is marked as + isolated. A few marginal cases are marked +/−. A. Protein obtained from E. coli grown on media containing [2-13C]-glucose. B. Protein obtained from P. aeruginosa grown on media containing [2-13C]-glucose. C. Protein obtained from P.aeruginosa grown on media containing [2-13C]-glycerol.
Figure 8
Figure 8
Comparison of one-dimensional solid-state 15N NMR NMR spectra of 100% uniformly 15N labelled and fractional uniformly 13C labelled samples of Pf1 coat protein obtained from P. aeruginosa. A., C., E., and G. were obtained with both 1H and 13C decoupling. B., D., F., and H. were obtained with only 1H decoupling. A. and B. 45% uniformly 13C labelled. C. and D. 25% uniformly 13C labelled. E. and F. Protein obtained from bacteria grown on 1,3 -13C glycerol-containing media. G. and H. Protein obtained from bacteria grown on I, 2-13C glucose- containing media.
Figure 9
Figure 9
Comparison of two-dimensional 1H-13C PISEMA spectra of aligned Pf1 bacteriophage samples. A. 100% uniformly 13C labelled. B. - E. Fractional uniformly 13C labelled at the indicated percentages. F. From bacteria grown on [2-13C] glycerol-containing media. G. From bacteria grown on [1,3-13C] glycerol-containing media. H. From bacteria grown on [2-13C] glucose-containing media.
Figure 10
Figure 10
Comparison of single-to-noise ratios and resonance linewidths in the 1H-13C PISEMA spectra of aligned Pf1 bacteriophage. The error bars represent the estimated uncertainty in the measurements made on the experimental spectra in Figure 9. A. Signal-to-noise ratios of the one-dimensional solid-state NMR spectra. B. Full width at half height of the 13C chemical shift dimension. C. Full width at half height of 1H-13C dipolar coupling dimension. Left panels: The percentages listed on the bottom correspond to the extent of fractional uniform 13C labeling. Right panels: 13C labeling from bacteria grown in media containing D. [2-13C] glycerol. E. [1,3-13C] glycerol. F. [2-13C] glucose.

References

    1. Opella SJ, Marassi FM. Structure determination of membrane proteins by NMR spectroscopy. Chem Rev. 2004;104:3587–3606. - PMC - PubMed
    1. Cross TA, DiVerdi JA, Opella SJ. Strategy for nitrogen NMR analysis of biopolymers. J Am Chem Soc. 1982;104:1759–61.
    1. Gu Z, Opella SJ. Three-dimensional 13C Shift/1H-15N Coupling/15N Shift solid-state NMR correlation spectroscopy. J Magn Reson. 138:193–198. - PubMed
    1. Gu Z, Opella SJ. Two- and three- dimensional 1H/13C PISEMA experiments and their application to backbone and side chain sites of amino acids and peptides. J Magn Reson. 1999b;140:340–346. - PubMed
    1. Schneider DM, Tycko R, Opella SJ. High-resolution solid-state triple nuclear magnetic resonance measurement of 13C-15N dipole-dipole couplings. J Magn Reson. 1987;73:568–573.

Publication types

MeSH terms

LinkOut - more resources