. 2010 Feb;138(2):671-81, 681.e1-2.
doi: 10.1053/j.gastro.2009.09.021. Epub 2009 Sep 24.

Silymarin inhibits in vitro T-cell proliferation and cytokine production in hepatitis C virus infection

Affiliations

Silymarin inhibits in vitro T-cell proliferation and cytokine production in hepatitis C virus infection

Chihiro Morishima et al. Gastroenterology. 2010 Feb.

Abstract

Background & aims: Silymarin, an extract from the seeds of the milk thistle plant Silybum marianum, has been used for centuries for the treatment of chronic liver diseases. Despite common use by patients with hepatitis C in the United States, its clinical efficacy remains uncertain. The goal of this study was to determine whether silymarin has in vitro effects on immune function that might have implications for its potential effect on hepatitis C virus (HCV)-induced liver disease.

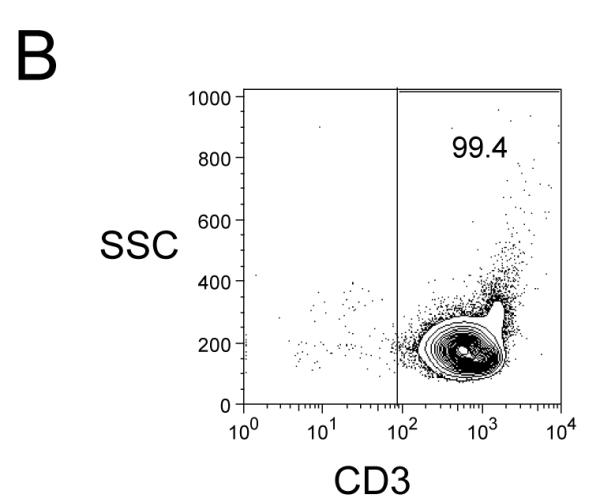
Methods: Freshly isolated peripheral blood mononuclear cells (PBMC) and T cells from HCV-infected and uninfected subjects were tested in vitro for responses to nonspecific and antigenic stimulation in the presence and absence of a standardized preparation of silymarin (MK001).

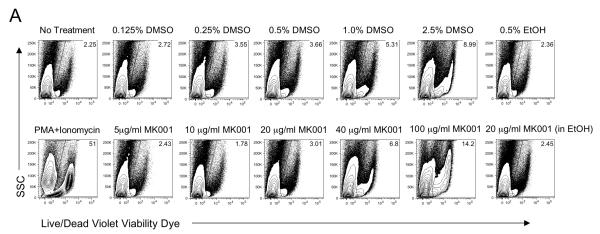
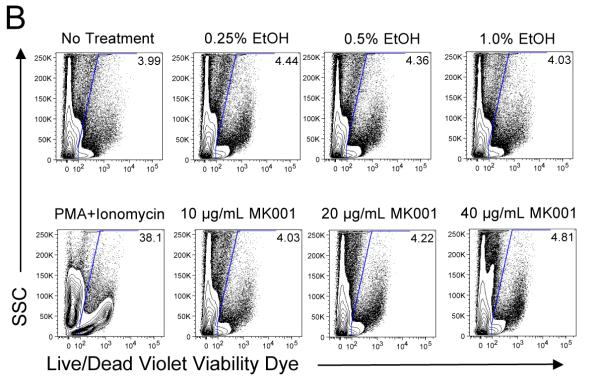
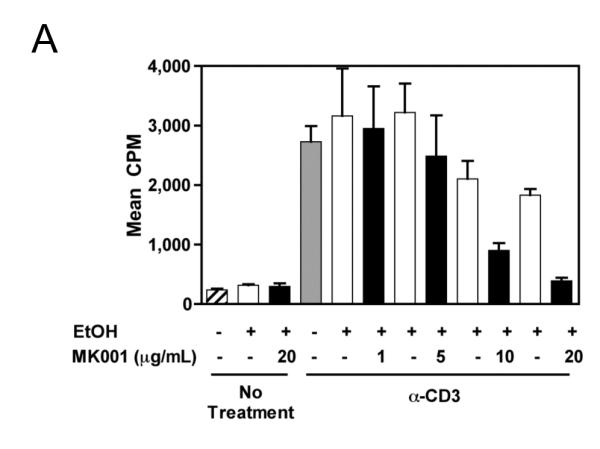
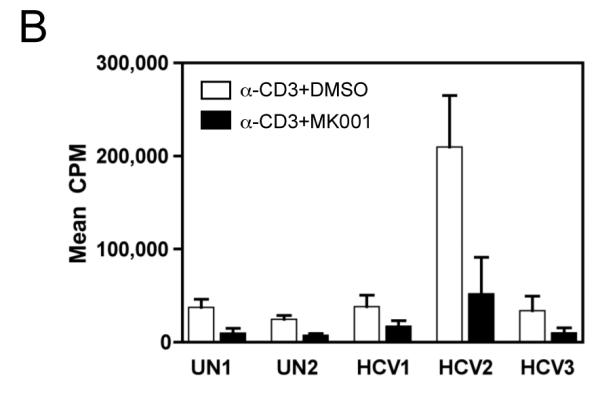
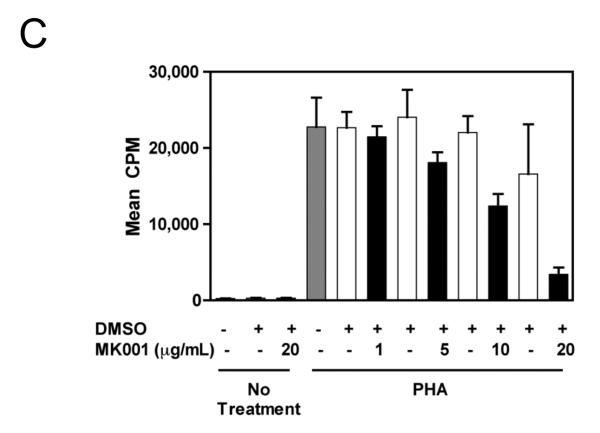
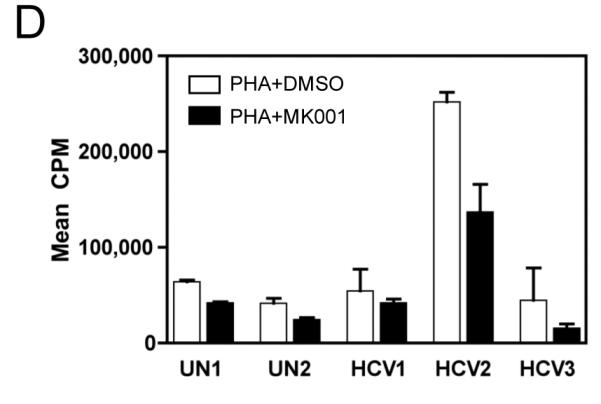
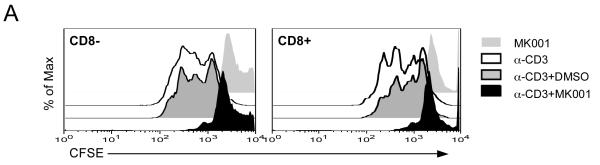
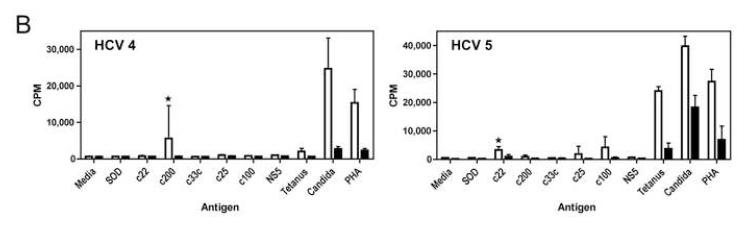
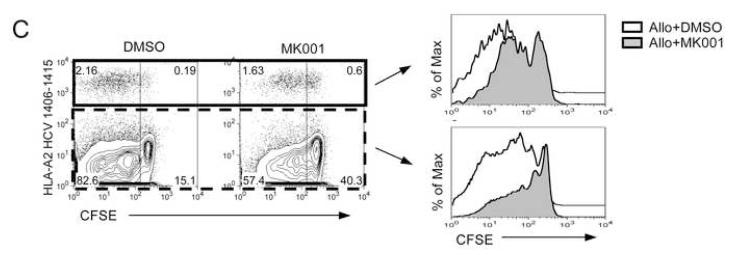
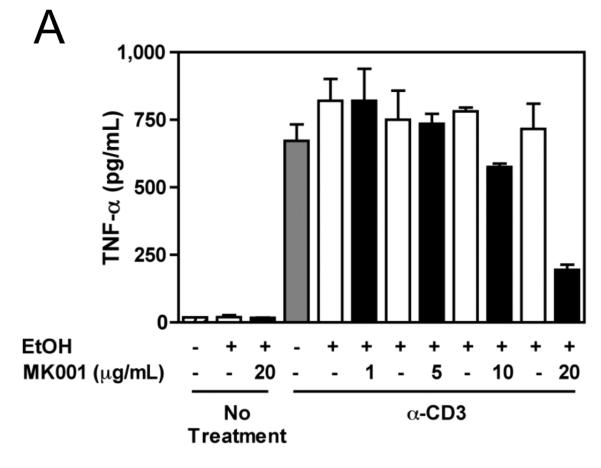
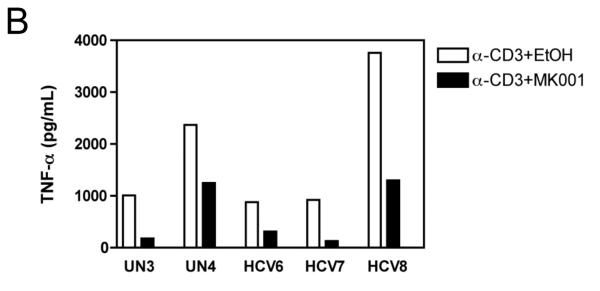
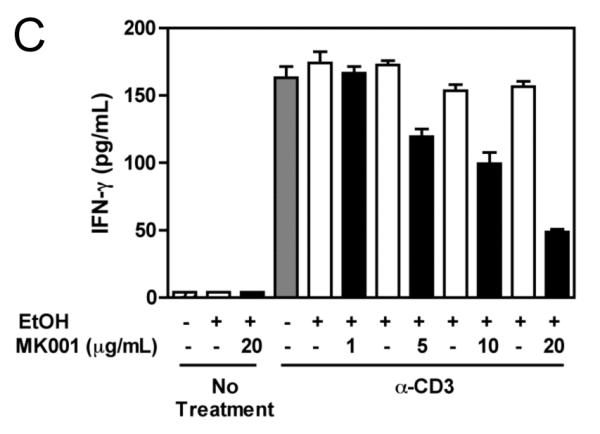
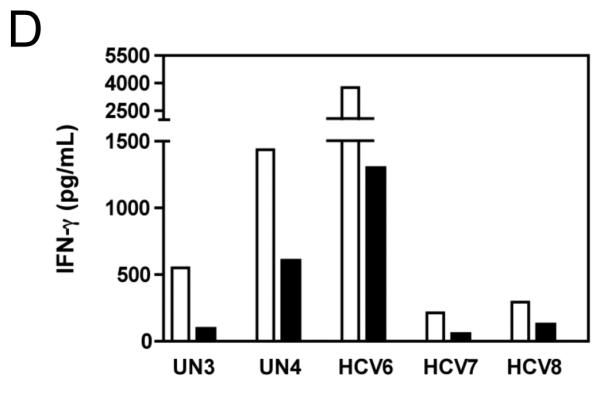
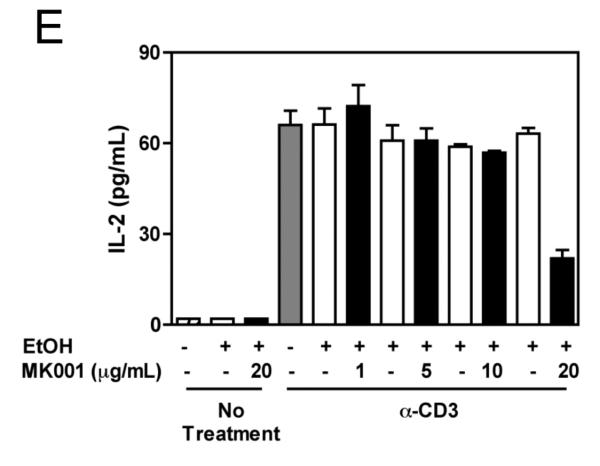
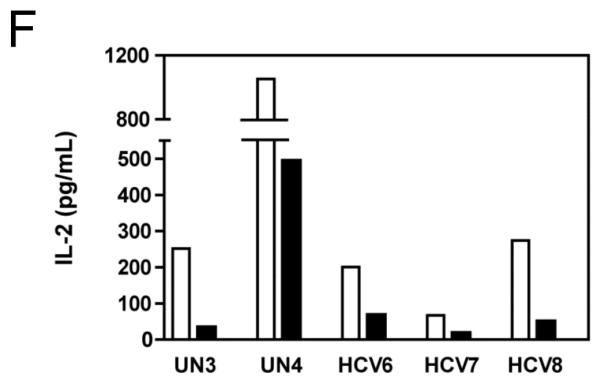
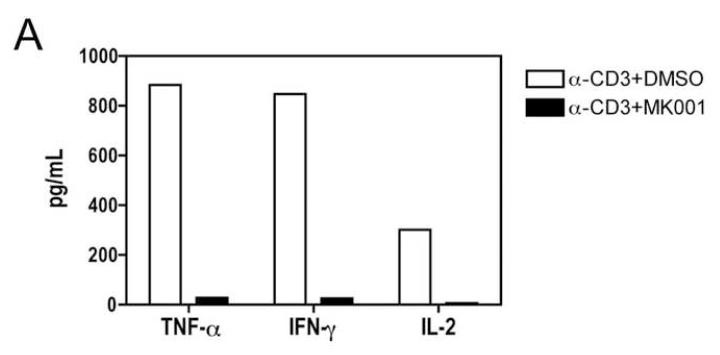
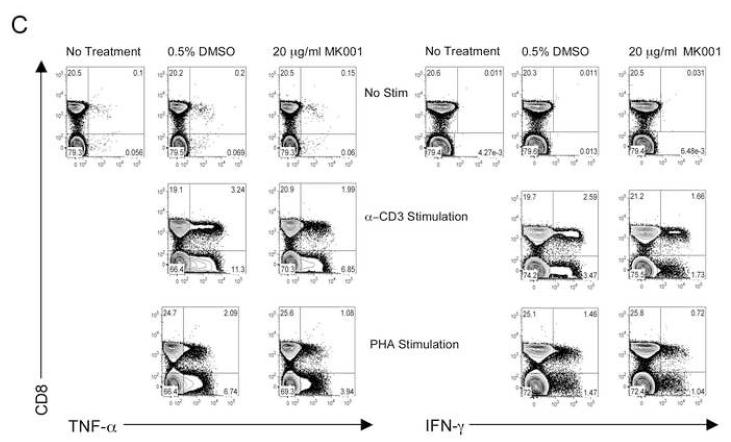
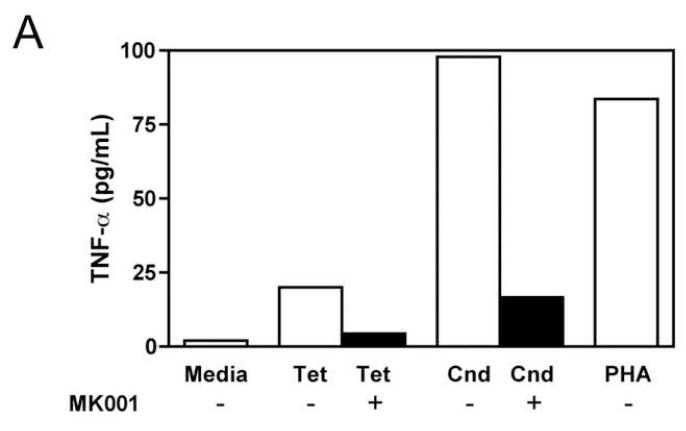
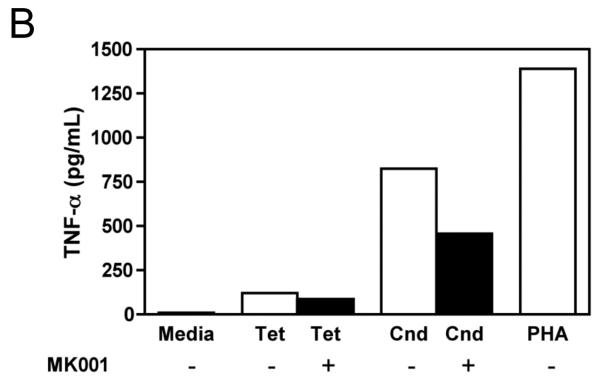
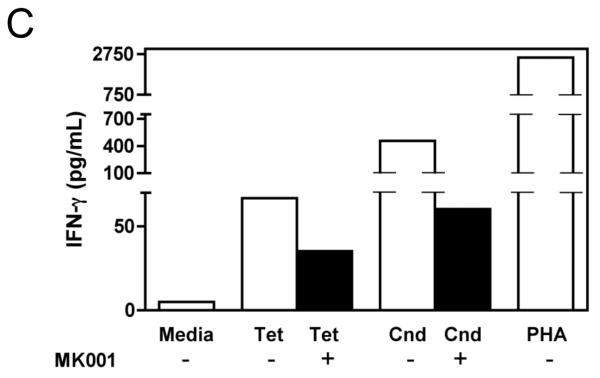
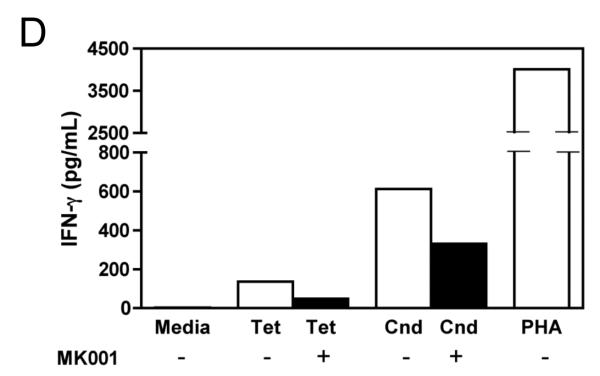
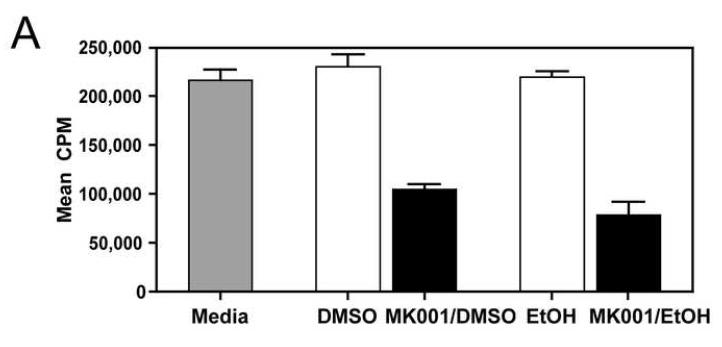
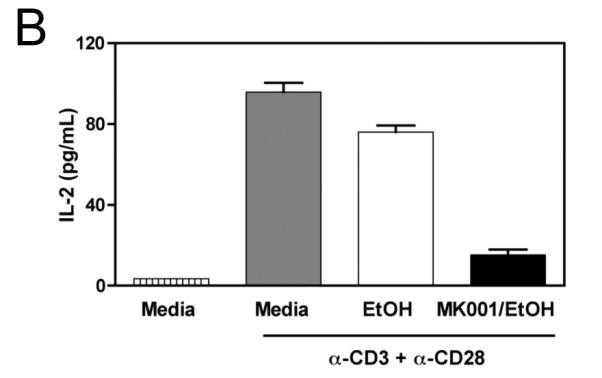
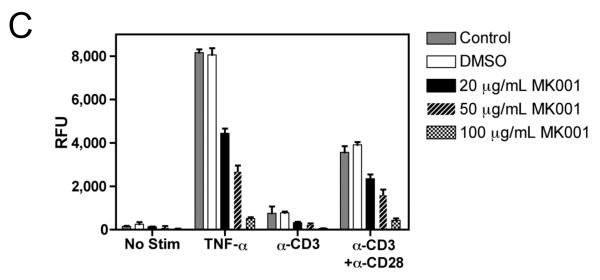
Results: Minimal MK001 toxicity on PBMC was found at concentrations between 5 and 40 microg/mL. MK001 dose dependently inhibited the proliferation and secretion of tumor necrosis factor (TNF)-alpha, interferon (IFN)-gamma, and interleukin (IL)-2 by PBMC stimulated with anti-CD3. In addition, MK001 inhibited proliferation by CD4(+) T cells to HCV, Candida, and tetanus protein antigens and by HLA-A2/HCV 1406-1415-specific CD8(+) T cells to allogeneic stimulation. MK001 inhibited T-cell TNF-alpha and IFN-gamma cytokine secretion to tetanus and Candida protein antigens. Finally, MK001 inhibited nuclear factor-kappaB transcriptional activation after T-cell receptor-mediated stimulation of Jurkat T cells, consistent with its ability to inhibit Jurkat T-cell proliferation and secretion of IL-2.

Conclusions: Silymarin's ability to inhibit the proliferation and proinflammatory cytokine secretion of T cells, combined with its previously described antiviral effect, suggests a possible mechanism of action that could lead to clinical benefit during HCV infection.


Figures

Figure 1
Figure 1. Minimal effects of silymarin on cell viability
PBMC from representative HCV-infected subjects were cultured with media, and with various concentrations of MK001 dissolved in DMSO or ethanol vehicle or with corresponding vehicle controls (DMSO or ethanol alone) for 24 hours. PBMC were unstimulated (A) or stimulated with anti-CD3 (B) at culture initiation. Cells were labeled with Live/Dead Fixable Dead Cell Stain Kit (Violet viability dye, x-axis) and analyzed by flow cytometry. Non-viable cells take up the dye, and the percentage of non-viable cells is indicated in the upper right corner of each plot. Positive control samples treated with PMA/ionomycin for 24 hours exhibited significant cell death (bottom left, panels A and B). Similar results were found upon analysis of the CD4+ and CD8+ T cell compartments for both unstimulated and stimulated cells. Two additional experiments from uninfected subjects demonstrated similar results (data not shown).
Figure 2
Figure 2. MK001 inhibition of PBMC proliferation is dose dependent
For all assays, a single dose of MK001 was added at culture initiation and compared to parallel cultures treated with a single dose of MK001 vehicle (DMSO or EtOH). Freshly isolated PBMC were tested in quadruplicate for proliferative responses to plate-bound anti-CD3 (10 μg/mL) (A, B) or PHA (1.6 μg/mL) (C, D) stimulation measured at 24 hours using 3H-thymidine incorporation. Results are shown as mean cpm incorporated in cultures treated with MK001 at various doses (black bars) or with the corresponding vehicle control (Ethanol or DMSO, open bars). Gray bars represent proliferation of PBMC stimulated with anti-CD3 or PHA alone. Error bars indicate 1 standard deviation among 4 replicates for each condition. PBMC for representative dose response experiments shown were obtained from HCV-infected (A) and HCV-uninfected (C) subjects. Similar dose response results were obtained in 5 additional HCV-infected and 1 additional HCV-uninfected subjects. Results from individual HCV-infected and uninfected subjects tested with MK001 (20 μg/mL) are also shown (B, D). Results from MK001-treated samples were statistically different from vehicle-treated samples (Wilcoxon matched pairs test, p=0.03 for anti-CD3 or PHA separately).
Figure 3
Figure 3. MK001 Inhibits antigen-specific and nonspecific T cell proliferation
For all assays, a single dose of MK001 (20 μg/mL) was added at culture initiation and compared to parallel cultures treated with a single dose of vehicle alone (DMSO). (A) Fresh PBMC from a representative HCV-infected subject was exposed to CFSE for 10 minutes, then washed and cultured with media, anti-CD3 (platebound,10 μg/mL) alone, anti-CD3 + DMSO, or anti-CD3 + MK001 in DMSO overnight. Flow cytometric analyses of live CD45-expressing lymphocytes that were also CD5-positive allowed the detection of cell proliferation in both CD8− (left panel) and CD8+ (right panel) T cell populations. Y-axis indicates the percentage of maximum cell number (note offset histograms). CD8−CD5+ T cells were confirmed to be CD4+CD5+ T cells, equivalent to CD8−CD3+ and CD4+CD3+, respectively (data not shown). (B) Freshly isolated PBMC from two HCV-infected subjects were exposed to HCV and recall antigens, and PHA for 5 days, as described. Results are shown for 3H-thymidine uptake measured in mean cpm (counts per minute) incorporated into replicate cultures treated (black bars) or untreated (open bars) with MK001. HCV-specific responses considered to be significantly inhibited (HCV-positive to HCV-negative) are indicated by the asterisks. Similar results were obtained from 4 additional HCV-infected subjects. The threshhold for a positive HCV-specific response was a stimulation index of >4.0. Error bars indicate 1 standard deviation among 4 replicates for each condition. (C) T cells from an HCV-infected HLA-A2+ subject were expanded from PBMC using the 9-mer HCV 1406-1415 and rhIL-2 at 37°C, 5% CO2 for 12 days. Cells were exposed to CFSE for 10 minutes, then washed and cultured with allogeneic B-LCL with MK001 (20 μg/mL) in DMSO or with DMSO alone. Three days later the cells were surface labeled with fluorescently conjugated anti-CD3, anti-CD8 and pentamer HLA-A2-HCV NS3 1406-1415 and analyzed using a BD FACS Calibur and FlowJo software. Live lymphocytes that express CD3 and CD8 were gated upon. Shown in the upper right quadrant are cells that bind the pentamer and contain CFSE. Cells that have divided are CFSE-negative and are found in the left quadrants. Offset histogram plots indicate the difference in cellular proliferation between MK001 (gray) and DMSO (vehicle, white)-treated pentamer-positive (top) or pentamer-negative (bottom) T cells.
Figure 4
Figure 4. MK001 dose-dependently inhibits TNF-α, IFN-γ, and IL-2 secretion by stimulated human PBMC in vitro
PBMC from an HCV-infected subject were stimulated with plate-bound anti-CD3 (10 μg/mL) or negative controls (95% EtOH or media) in the presence of MK001 (in 95% EtOH) or vehicle alone. Supernatants collected 24 hours after stimulation were tested by multiplex ELISA for the presence of TNF-α (A), IFN-γ (C), or IL-2 (E) as described. White bars indicate samples treated without MK001 but with vehicle, black bars indicated samples treated with MK001 in vehicle. Gray bars represent proliferation of PBMC stimulated with anti-CD3 alone. PBMC from additional HCV-infected and uninfected control subjects were tested similarly and the consistent effect of MK001 (20 μg/mL) on TNF-α (B), IFN-γ (D), and IL-2 (F) secretion is shown. Similar dose response results to those shown were found using PBMC from both an HCV-infected and an uninfected subject. Results from MK001-treated samples were statistically different from vehicle-treated samples (Wilcoxon matched pairs test, p=0.03 for each cytokine separately).
Figure 5
Figure 5. T cell secretion of TNF-α, IFN-γ, and IL-2 is inhibited by MK001
(A) PBMC from an HCV-infected subject were enriched for T cells and cultured with 0.5% DMSO or media (not shown) or plate-bound anti-CD3 (10 μg/mL) in the presence of MK001 (20 μg/mL) or vehicle (DMSO) for 24 hours. TNF-α, IFN-γ, and IL-2 levels in culture supernatants were evaluated using multiplex ELISA. Detection limits were 2 pg/mL, 2 pg/mL, and 4 pg/mL, respectively. (B) Purity of enriched CD3+ T cells used in (A) was assessed using flow cytometric analysis, gating on CD45+ live lymphocytes (NB: purity was 97.5% without gating). (C) PBMC from a second HCV-infected subject were stimulated with negative controls (DMSO or media) or plate-bound anti-CD3 (10 μg/mL), or PHA (1.6 μg/mL) in the presence of MK001 (20 μg/mL) or vehicle (DMSO) for 16 hours. Intracellular TNF-α and IFN-γ cytokine expression were evaluated in the presence of 1 μg/mL brefeldin A. Violet viability dye was used to distinguish live cells (from dead), and cells were further selected on the basis of CD5 expression and the absence of CD56 expression. TNF-α expression (x-axis, left panels) and IFN-γ (x-axis, right panels) from live CD5+CD8+CD56- lymphocytes are shown in the upper right quadrant. Percentages of cells in each quadrant are displayed. Cytokines detected in the CD5+CD8-CD56- population were confirmed to derive from CD5+CD4+CD56- cells in the same experiment, and CD5+CD8+ T cells previously confirmed to represent the same population as CD3+CD8+ T cells (data not shown).
Figure 6
Figure 6. Inhibition of TNF-α and IFN-γ secretion by Tetanus toxoid and Candida albicans-specific T cells
Fresh PBMC from two representative HCV-infected subjects (A, C and B, D) were cultured with Tetanus and Candida protein antigens and PHA, with or without MK001 (20 μg/mL) for 4 days. Culture supernatants were frozen at −80°C and subsequently tested by multiplex ELISA for the presence of TNF-α and IFN-γ (sensitivity of detection: 2 pg/mL for both). No cytokine secretion was detected in the absence of protein antigens. Similar results were obtained in 5 HCV-infected and 2 HCV-uninfected subjects.
Figure 7
Figure 7. MK001 inhibits proliferation, IL-2 secretion, and NF-κB-mediated transcription in the Jurkat T cell line
(A) Spontaneous proliferation of the human Jurkat tumor cell line was detected using 3H-thymidine incorporation (mean cpm of quaduplicate wells). Results from parallel cultures treated with MK001 (20 μg/mL) dissolved in either DMSO or 95% ethanol are shown in this representative experiment. (B) Jurkat T cells were stimulated to produce IL-2 using plate-bound anti-CD3 and soluble anti-CD28 stimulation, and compared to the negative control (95% ethanol) and MK001 (20 μg/mL) treatment. IL-2 was quantified in supernatants collected 24 hours after stimulation using ELISA. (C) Jurkat T cells were transfected with 5 μg of a plasmid encoding a luciferase reporter gene under the control of an NF-κB responsive promoter. Cells were treated with MK001 or DMSO for 30 minutes prior to stimulation. (No cellular toxicity has been noted with the MK001 concentrations used at 30 minutes, data not shown). NF-κB transcription was activated via the TCR using plate-bound anti-CD3, anti-CD3 + anti-CD28 antibodies, or with 15 ng/mL TNF-α, and luciferase activity was measured 4 hours after TCR activation or TNF-α treatment. Treatment with MK001 resulted in a dose-dependent inhibition of TCR-induced NF-κB activation. Error bars in all panels indicate one standard deviation among 4 replicates per condition.

References

    1. Alter HJ, Seeff LB. Recovery, persistence, and sequelae in hepatitis C virus infection: a perspective on long-term outcome. Seminars in Liver Disease. 2000;20:17–35. - PubMed
    1. Manns MP, McHutchison JG, Gordon SC, Rustgi VK, Shiffman M, Reindollar R, Goodman ZD, Koury K, Ling M, Albrecht JK. Peginterferon alfa-2b plus ribavirin compared with interferon alfa-2b plus ribavirin for initial treatment of chronic hepatitis C: a randomised trial. Lancet. 2001;358:958–65. - PubMed
    1. Fried MW, Shiffman ML, Reddy KR, Smith C, Marinos G, Goncales FL, Haussinger D, M D, G C, Dhumeaux D, Craxi A, Lin A, Hoffmann J, Yu J. Peginterferon alfa-2a plus ribavirin for chronic hepatitis C virus infection. New England Journal of Medicine. 2002;347:975–982. - PubMed
    1. Davis GL, Albright JE, Cook SF, Rosenberg DM. Projecting future complications of chronic hepatitis C in the United States. Liver Transpl. 2003;9:331–8. - PubMed
    1. Strader DB, Bacon BR, Lindsay KL, La Brecque DR, Morgan T, Wright EC, Allen J, Khokar MF, Hoofnagle JH, Seeff LB. Use of complementary and alternative medicine in patients with liver disease. Am J Gastroenterol. 2002;97:2391–7. - PubMed

Publication types

MeSH terms