. 2009 Dec 5;395(1):121-32.
doi: 10.1016/j.virol.2009.08.039. Epub 2009 Sep 25.

Characteristics of alpha/beta interferon induction after infection of murine fibroblasts with wild-type and mutant alphaviruses

Affiliations

Characteristics of alpha/beta interferon induction after infection of murine fibroblasts with wild-type and mutant alphaviruses

Crystal W Burke et al. Virology. .

Abstract

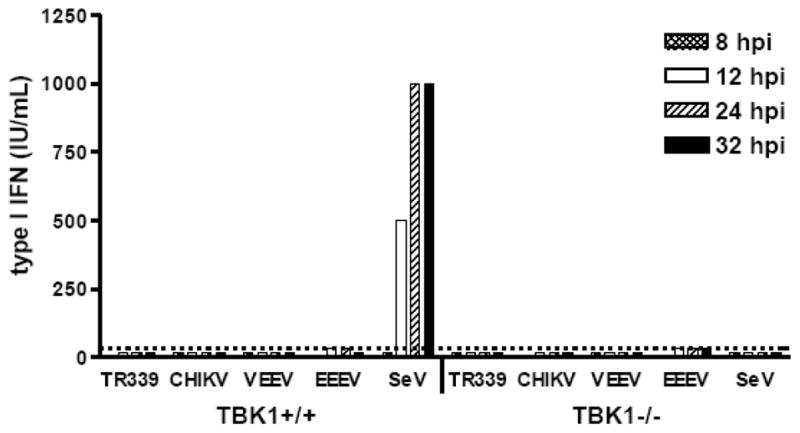
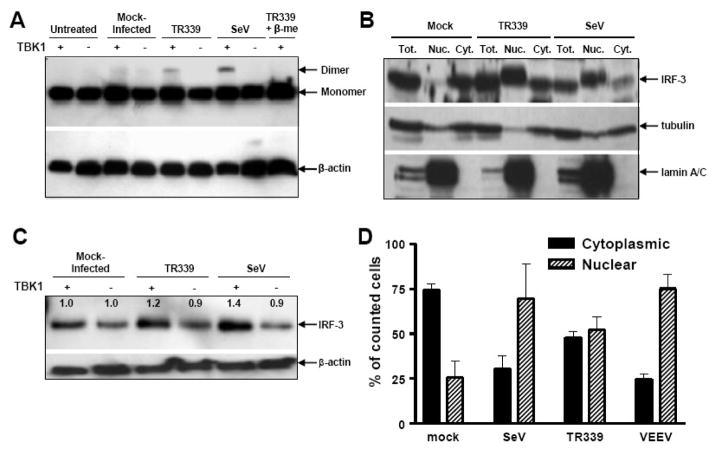
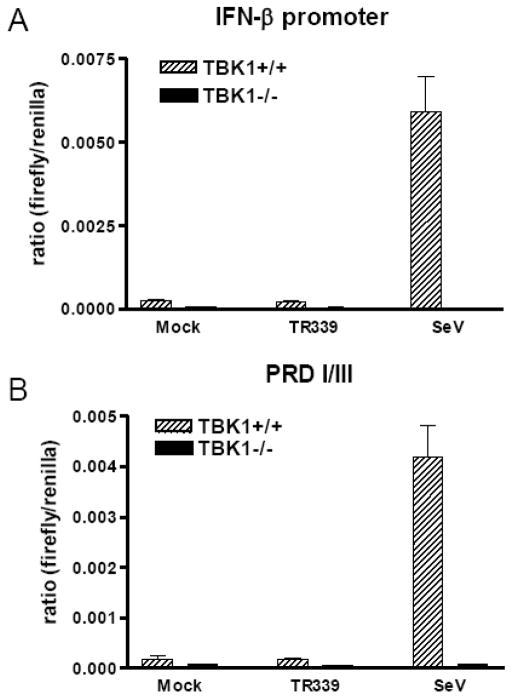
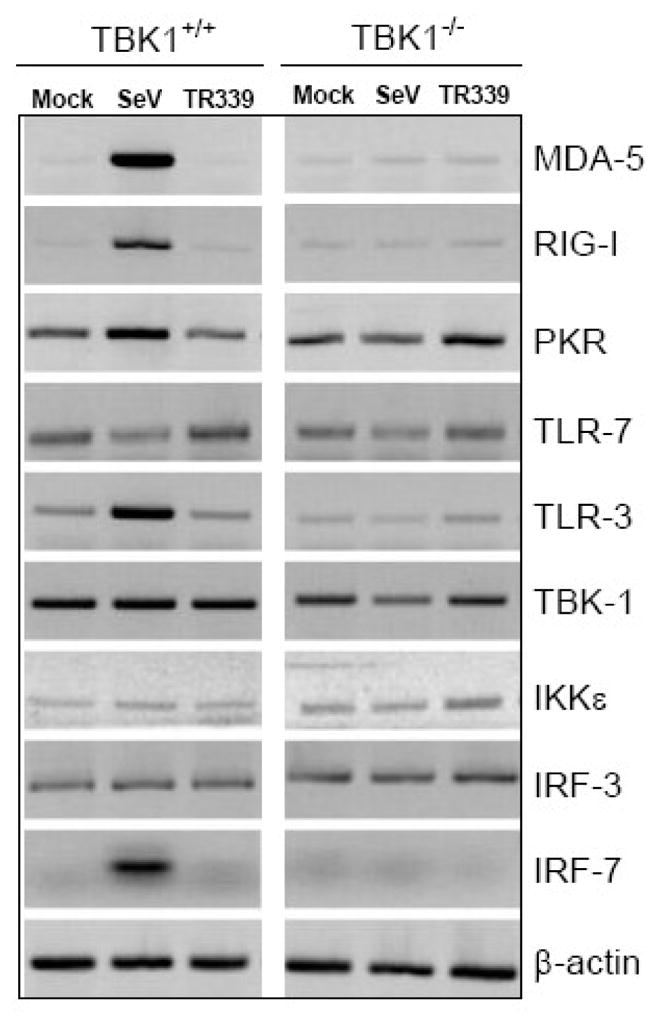
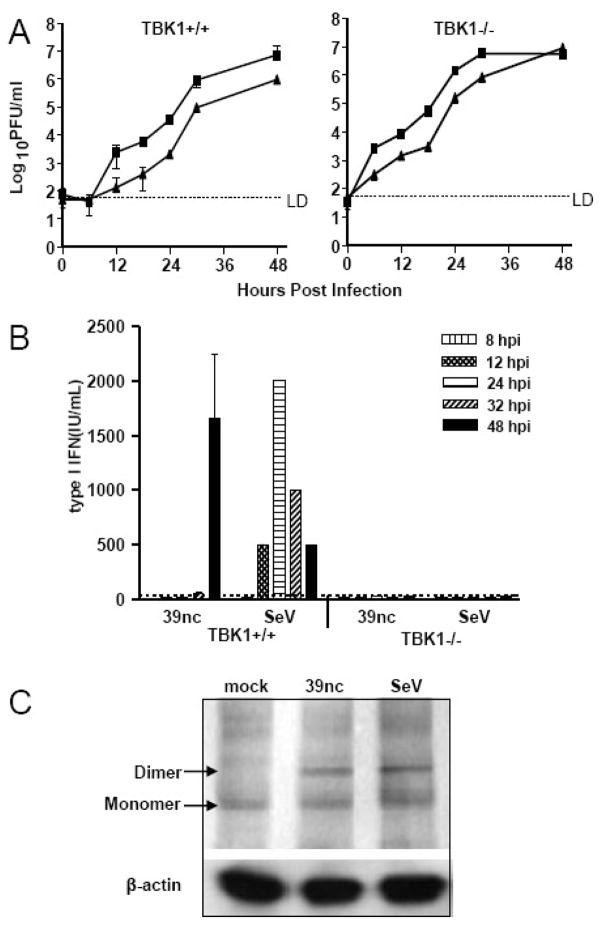
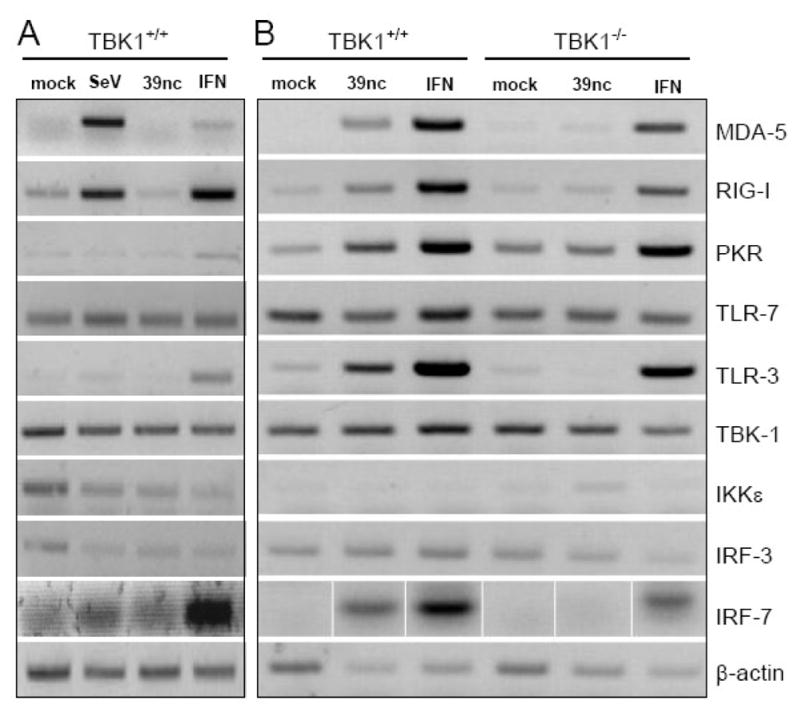
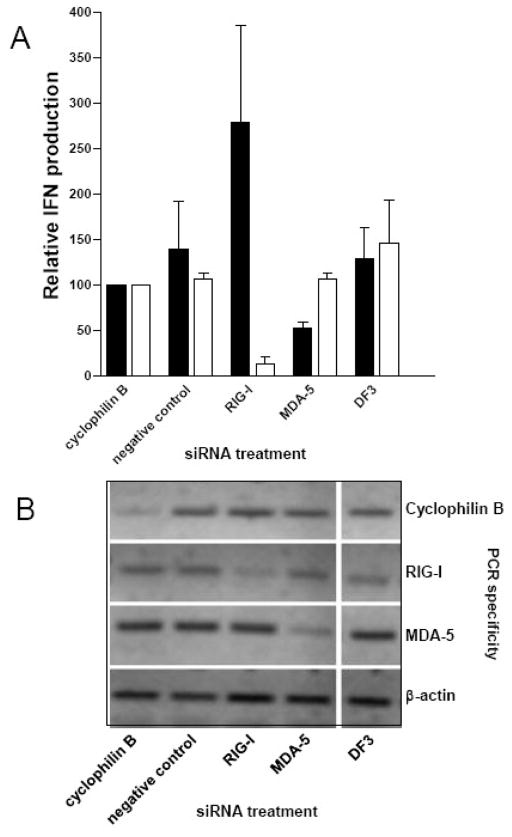
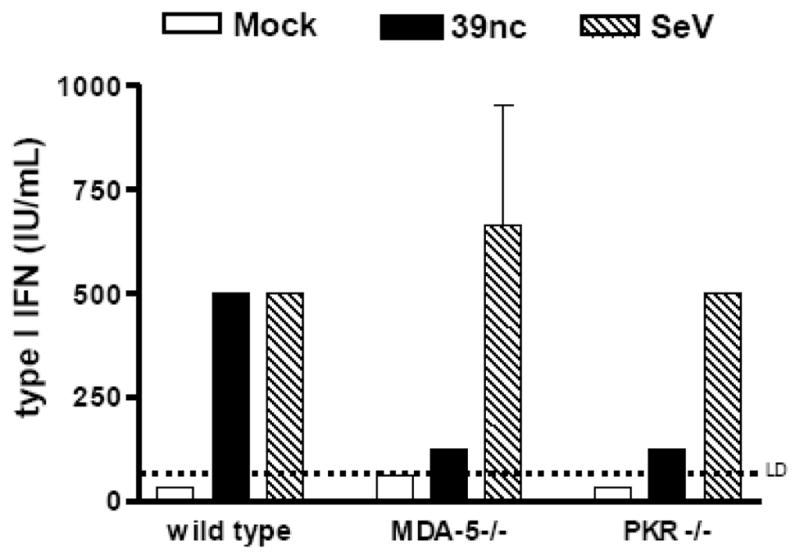
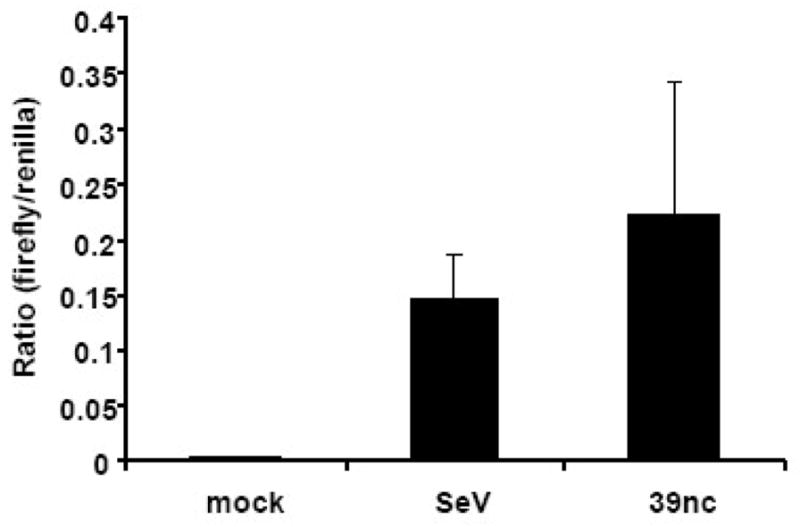
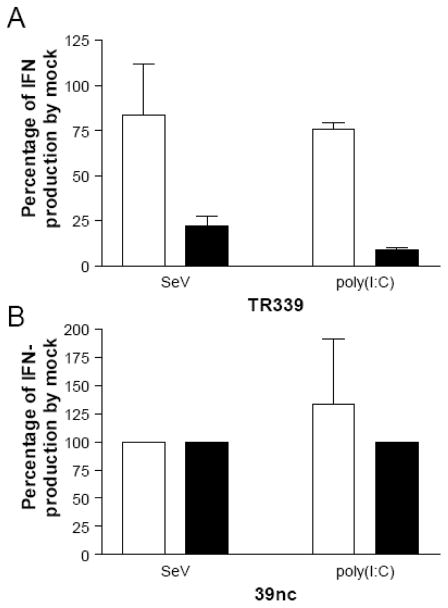
We examined the characteristics of interferon alpha/beta (IFN-alpha/beta) induction after alphavirus or control Sendai virus (SeV) infection of murine fibroblasts (MEFs). As expected, SeV infection of wild-type (wt) MEFs resulted in strong dimerization of IRF3 and the production of high levels of IFN-alpha/beta. In contrast, infection of MEFs with multiple alphaviruses failed to elicit detectable IFN-alpha/beta. In more detailed studies, Sindbis virus (SINV) infection caused dimerization and nuclear migration of IRF3, but minimal IFN-beta promoter activity, although surprisingly, the infected cells were competent for IFN production by other stimuli early after infection. A SINV mutant defective in host macromolecular synthesis shutoff induced IFN-alpha/beta in the MEF cultures dependent upon the activities of the TBK1 IRF3 activating kinase and host pattern recognition receptors (PRRs) PKR and MDA5 but not RIG-I. These results suggest that wild-type alphaviruses antagonize IFN induction after IRF3 activation but also may avoid detection by host PRRs early after infection.


Figures

Figure 1
Figure 1. Interferon production from MEFs after infection with different alphaviruses
Control and TBK1−/− MEFs were infected with each virus for 1 h at 37°C at an MOI of 3. Supernatants were harvested for biological interferon assay at the times indicated. Each bar represents the average of triplicate samples. Error bars are standard deviations but are too small to be seen. Some of these data were published previously (Ryman & Klimstra, 2009).
Figure 2
Figure 2. Activation and nuclear translocation of IRF3 after infection of MEFs
A) Control or TBK1−/−MEFs were mock infected or infected with each virus at an MOI of 3 and lysates were harvested at 12 h p.i. for Native-PAGE separation of proteins and western blot for IRF3. B) Cells were infected as in A and processed for fractionation as described in Materials and Methods. Proteins transferred to membranes were stained with either IRF3 or fractionation control proteins tubulin or lamin A/C. C) Cells were infected and harvested as in A and processed for oligonucleotide pull down assay and IRF3 western blots as described in Materials and Methods. Numbers in the figure indicate relative levels of bound IRF3 with values for mock-infected cells set to 1.0. Values from virus-infected cells are presented as a ratio to mock for each cell type. D) Control MEFS were transfected with a plasmid encoding an IRF3/GFP fusion protein as described in Materials and Methods followed by mock infection or infection with each virus 18 h later at an MOI of 3. At 8 h p.i., appropriate cells were stained for either SINV or VEEV structural proteins. Then the subcellular location of GFP signal was scored in triplicate using fluorescence microscopy for at least 50 cells in which virus proteins and GFP were co-localized. Error bars are standard deviations and some are too small to be seen.
Figure 3
Figure 3. Interferon promoter activity after SINV TR339 infection of MEFs
Control and TBK1−/− MEFs were co-transfected with the A) IFN-β promoter or B) PRDI/III and a renilla control reporter constructs as described in Materials and Methods. Approximately 18 h later, the cells were mock infected or infected with each virus at an MOI of 3. At 12 h p.i., lysates were harvested for dual luciferase assay. Data are presented as the ratio of relative light units (RLU) from a control renilla luciferase-expressing plasmid to RLU from each inducible reporter. Error bars represent standard deviations and some are too small to be seen.
Figure 4
Figure 4. RT-PCR for mRNAs encoding IFN induction pathway components
Control or TBK1−/−MEFS were mock-infected or infected with each virus at an MOI of 3 followed by harvesting of total RNA at 8 h p.i. RT-PCR for eachmRNA and agarose gel separation of products was performed as described in Materials and Methods.
Figure 5
Figure 5. Virus replication, IFN-α/β induction and IRF3 activation after SINV 39nc infection of MEFs
A) Control or TBK1−/− MEFs were infected with SINV TR339 (squares) or SINV 39nc (triangles) at an MOI of 3 and supernatants were harvested at various intervals for plaque titration of virus. B) Control or TBK1−/− MEFs were infected with each virus at an MOI of 3 and supernatants were collected for biological interferon assay at the times indicated. Some of these data were published previously (Ryman & Klimstra, 2009). C) Control cells were mock-infected or infected with each virus at an MOI of three and processed for IRF3 dimerization analysis as described in Materials and Methods at 12 h p.i. (SeV) or 24 h p.i. (SINV 39nc). Error bars are standard deviations and some are too small to be seen.
Figure 6
Figure 6. Effects of SINV 39nc infection upon abundance of mRNAs for interferon induction pathway components
Control or TBK1−/−MEFS were mock-infected, infected with SeV or SINV 39nc at an MOI of 3, or treated with 1000 IU/ml of IFN-α/β followed by harvesting of total RNA at either 8 h p.i. (A), or 24 h p.i. (B). RT-PCR for each mRNA and agarose gel separation of products was performed as described in Materials and Methods.
Figure 7
Figure 7. siRNA-mediated knockdown of MDA5 or RIG-I
A) Control MEFs were transfected with siRNAs specific for cyclophilin B, RIG-I, MDA5, a non-targeting (negative) control or treated with transfection reagent (DF3). At 48 h post-treatment, cells were infected with SeV or SINV 39nc at an MOI of 3 and supernatants were collected for biological IFN-α/β assay at 12 h p.i. (SeV; open bars) or 48 h p.i. (SINV 39nc; solid bars). Results for other treatments are normalized to the cyclophilin B siRNA treatment which is set to 100%. Error bars are standard deviations. B) Semi-quantitative RT-PCR for mRNA of the target genes encoding cyclophilin B, RIG-I, MDA5 or β-actin which was used as a loading control. Samples are duplicates of the treatments described above. At 96 h post siRNA transfection, total RNA was harvested from mock-infected cells and processed for RT-PCR and agarose gel separation as described in Materials and Methods.
Figure 8
Figure 8. Interferon induction after infection of MDA5−/− or PKR−/− MEFs
Control MEFs (a different line for each knockout) or MDA5-deficient or PKR-deficient MEFs were infected with each virus at an MOI of 3. Supernatants were harvested at 24 h p.i. (SeV) or 48 h p.i. (SINV 39nc) for biological IFN-α/β assay. Each bar represents the average of triplicate samples. Error bars are standard deviations and some are too small to be seen.
Figure 9
Figure 9. Activation of the NFκB pathway after SINV 39nc infection
Wild type C57BL/6 MEFs were co-transfected with PRDII-dependent firefly luciferase and constitutive renilla reporters. At 24 h post-transfection, cells were mock-infected or infected with either SeV or SINV 39nc and lysates were collected for a dual luciferase assay at 12 h p.i. (SeV) or 48 h p.i. (mock and SINV 39nc) hpi. Data are presented as the ratio of relative light units (RLU) from a control renilla luciferase-expressing plasmid to RLU from each inducible reporter. Error bars are standard deviations and some are too small to be seen.
Figure 10
Figure 10. Effects of SINV infection upon IFN-α/β induction by IFN pathway agonists
WT MEFs were infected with SINV TR339 (A) or SINV 39nc (B) andtreated with SeV (infection) or poly(I:C) (transfection) either simultaneously with (open bars) or 6 hours after (black bars) SINV infection as described in Materials and Methods. IFN-α/β levels were measured at 24 hours post SINV infection and are presented as a percentage of those in control wells that were treated with SeV or poly(I:C) but not infected with SINV. Interferon was measured with either the IFN-α/β bioassay or an IFN-β ELISA (PBL). Error bars are standard deviations and some are too small to be seen.

References

    1. Aguilar PV, Weaver SC, Basler CF. Capsid protein of eastern equine encephalitis virus inhibits host cell gene expression. J Virol. 2007;81:3866–3876. - PMC - PubMed
    1. Anishchenko M, Paessler S, Greene IP, Aguilar PV, Carrara AS, Weaver SC. Generation and characterization of closely related epizootic and enzootic infectious cDNA clones for studying interferon sensitivity and emergence mechanisms of Venezuelan equine encephalitis virus. J Virol. 2004;78:1–8. - PMC - PubMed
    1. Atasheva S, Garmashova N, Frolov I, Frolova E. Venezuelan equine encephalitis virus capsid protein inhibits nuclear import in Mammalian but not in mosquito cells. J Virol. 2008;82:4028–4041. - PMC - PubMed
    1. Balachandran S, Roberts PC, Brown LE, Truong H, Pattnaik AK, Archer DR, Barber GN. Essential role for the dsRNA-dependent protein kinase PKR in innate immunity to viral infection. Immunity. 2000;13:129–141. - PubMed
    1. Barry GM, Breakwell L, Fragkoudis R, Attarzadeh-Yazdi G, Rodriguez-Andres J, Kohl A, Fazakerley JK. PKR acts early in infection to suppress Semliki Forest virus production and strongly enhances the type-I interferon response. J Gen Virol 2009 - PMC - PubMed

Publication types