

Outcomes, health policy, and managed care: relationships between patient-reported outcome measures and clinical measures in outpatients with heart failure
- PMID: 19782791
- PMCID: PMC2805910
- DOI: 10.1016/j.ahj.2009.07.010
Outcomes, health policy, and managed care: relationships between patient-reported outcome measures and clinical measures in outpatients with heart failure
Abstract
Background: Patient-reported outcomes are increasingly used to assess the efficacy of new treatments. Understanding relationships between these and clinical measures can facilitate their interpretation. We examined associations between patient-reported measures of health-related quality of life and clinical indicators of disease severity in a large, heterogeneous sample of patients with heart failure.
Methods: Patient-reported measures, including the Kansas City Cardiomyopathy Questionnaire (KCCQ) and the EuroQol Visual Analog Scale (VAS), and clinical measures, including peak VO(2), 6-minute walk distance, and New York Heart Association (NYHA) class, were assessed at baseline in 2331 patients with heart failure. We used general linear models to regress patient-reported measures on each clinical measure. Final models included for significant sociodemographic variables and 2-way interactions.
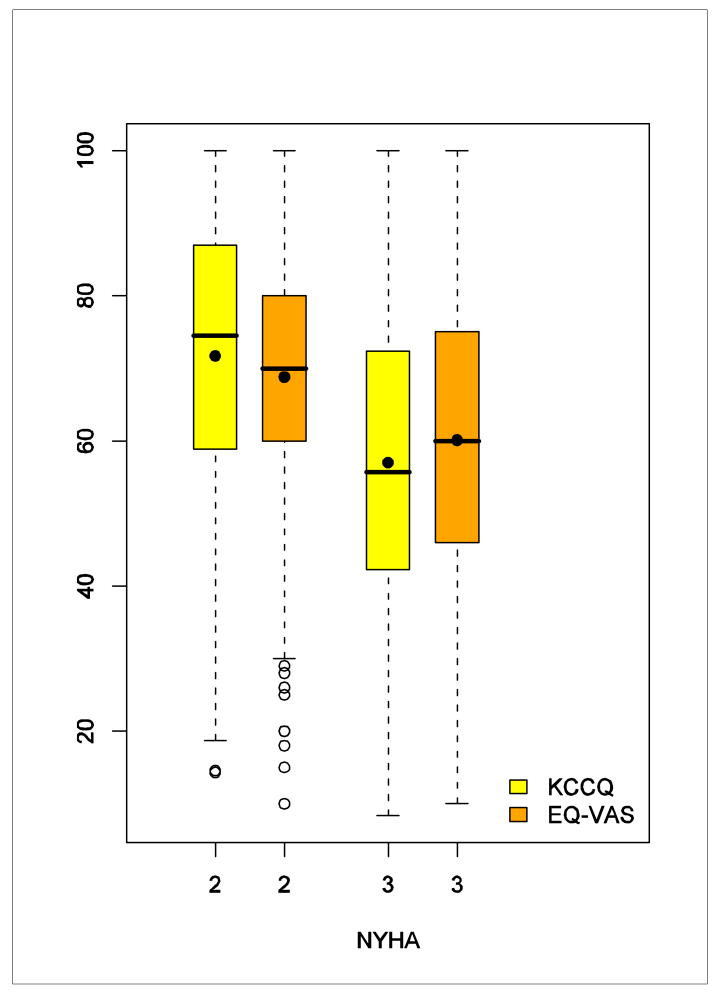
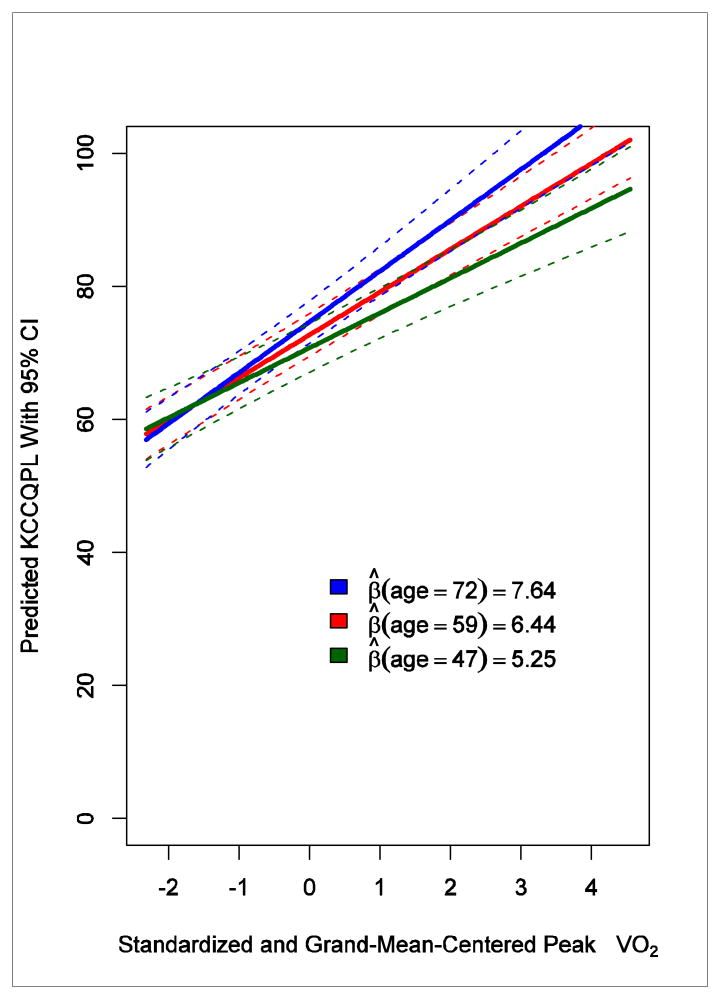
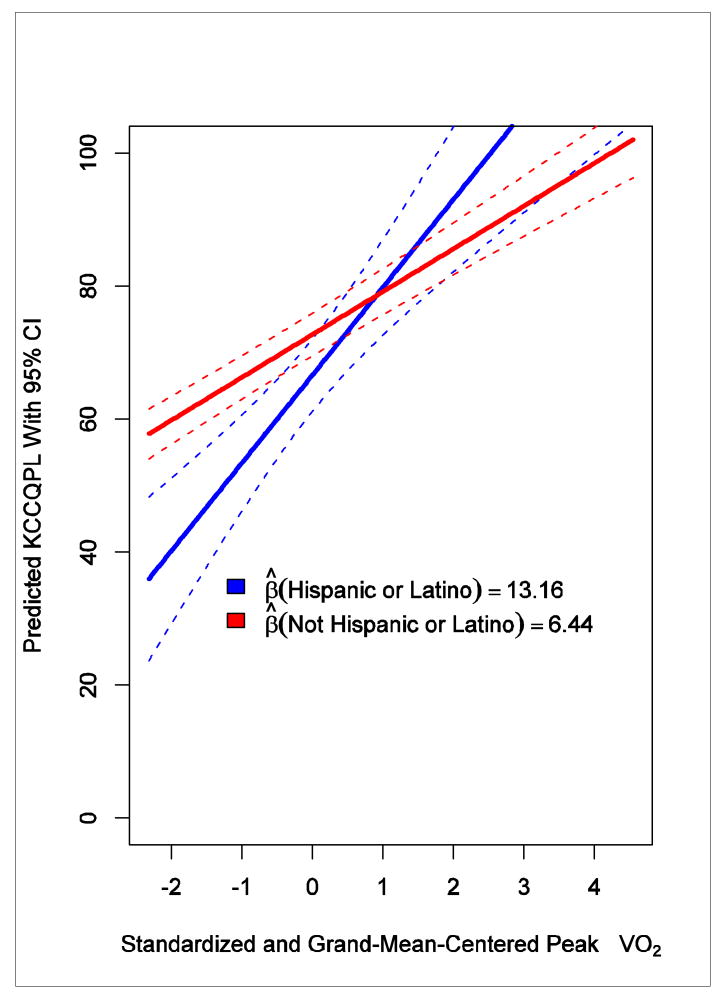
Results: The KCCQ was correlated with peak VO(2) (r = .21) and 6-minute walk distance (r = .27). The VAS was correlated with peak VO(2) (r = .09) and 6-minute walk distance (r = .11). Using the KCCQ as the response variable, a 1-SD difference in peak Vo(2) (4.7 mL/kg/min) was associated with a 2.86-point difference in the VAS (95% CI, 1.98-3.74) and a 4.75-point difference in the KCCQ (95% CI, 3.78-5.72). A 1-SD difference in 6-minute walk distance (105 m) was associated with a 2.78-point difference in the VAS (95% CI, 1.92-3.64) and a 5.92-point difference in the KCCQ (95% CI, 4.98-6.87); NYHA class III was associated with an 8.26-point lower VAS (95% CI, 6.59-9.93) and a 12.73-point lower KCCQ (95% CI, 10.92-14.53) than NYHA class II.
Conclusions: These data may inform deliberations about how to best measure benefits of heart failure interventions, and they generally support the practice of considering a 5-point difference on the KCCQ and a 3-point difference on the VAS to be clinically meaningful.
Trial registration: ClinicalTrials.gov NCT00047437.
Figures
References
-
- Weinberger M, Oddone EZ, Henderson WG. Does increased access to primary care reduce hospital readmissions? Veterans Affairs Cooperative Study Group on Primary Care and Hospital Readmission. N Engl J Med. 1996;334(22):1441–7. - PubMed
-
- Pina IL, Apstein CS, Balady GJ, Belardinelli R, Chaitman BR, Duscha BD, et al. Exercise and heart failure: A statement from the American Heart Association Committee on exercise, rehabilitation, and prevention. Circulation. 2003;107(8):1210–25. - PubMed
-
- Lewis EF, Johnson PA, Johnson W, Collins C, Griffin L, Stevenson LW. Preferences for quality of life or survival expressed by patients with heart failure. J Heart Lung Transplant. 2001;20(9):1016–24. - PubMed
-
- Patrick DL, Burke LB, Powers JH, Scott JA, Rock EP, Dawisha S, et al. Patient-reported outcomes to support medical product labeling claims: FDA perspective. Value Health. 2007;10(Suppl 2):S125–37. - PubMed
Publication types
MeSH terms
Associated data
Grants and funding
- U01 HL064257/HL/NHLBI NIH HHS/United States
- 5U01HL066461/HL/NHLBI NIH HHS/United States
- 5U01HL064264/HL/NHLBI NIH HHS/United States
- U01 HL064250/HL/NHLBI NIH HHS/United States
- P60AG10484/AG/NIA NIH HHS/United States
- U01 HL064265/HL/NHLBI NIH HHS/United States
- U01 HL064264/HL/NHLBI NIH HHS/United States
- 5U01HL066482/HL/NHLBI NIH HHS/United States
- 5U01HL066497/HL/NHLBI NIH HHS/United States
- U01 HL068980/HL/NHLBI NIH HHS/United States
- 5U01HL064250/HL/NHLBI NIH HHS/United States
- 5U01HL064265/HL/NHLBI NIH HHS/United States
- U01 HL066491/HL/NHLBI NIH HHS/United States
- 5U01HL068973/HL/NHLBI NIH HHS/United States
- 5U01HL064257/HL/NHLBI NIH HHS/United States
- U01 HL066482/HL/NHLBI NIH HHS/United States
- 5U01HL063747/HL/NHLBI NIH HHS/United States
- 5U01HL066491/HL/NHLBI NIH HHS/United States
- R37AG18915/AG/NIA NIH HHS/United States
- R37 AG018915/AG/NIA NIH HHS/United States
- U01 HL066494/HL/NHLBI NIH HHS/United States
- 5U01HL066501/HL/NHLBI NIH HHS/United States
- U01 HL066497/HL/NHLBI NIH HHS/United States
- 5U01HL066494,/HL/NHLBI NIH HHS/United States
- U01 HL066461/HL/NHLBI NIH HHS/United States
- U01 HL068973/HL/NHLBI NIH HHS/United States
- 5U01HL068980/HL/NHLBI NIH HHS/United States
- U01 HL063747/HL/NHLBI NIH HHS/United States
- U01 HL066501/HL/NHLBI NIH HHS/United States
