Review
. 2009 Dec;120(12):2040-2054.
doi: 10.1016/j.clinph.2009.08.009. Epub 2009 Sep 27.

Motoneuron excitability: the importance of neuromodulatory inputs

Affiliations
Review

Motoneuron excitability: the importance of neuromodulatory inputs

C J Heckman et al. Clin Neurophysiol. 2009 Dec.

Abstract

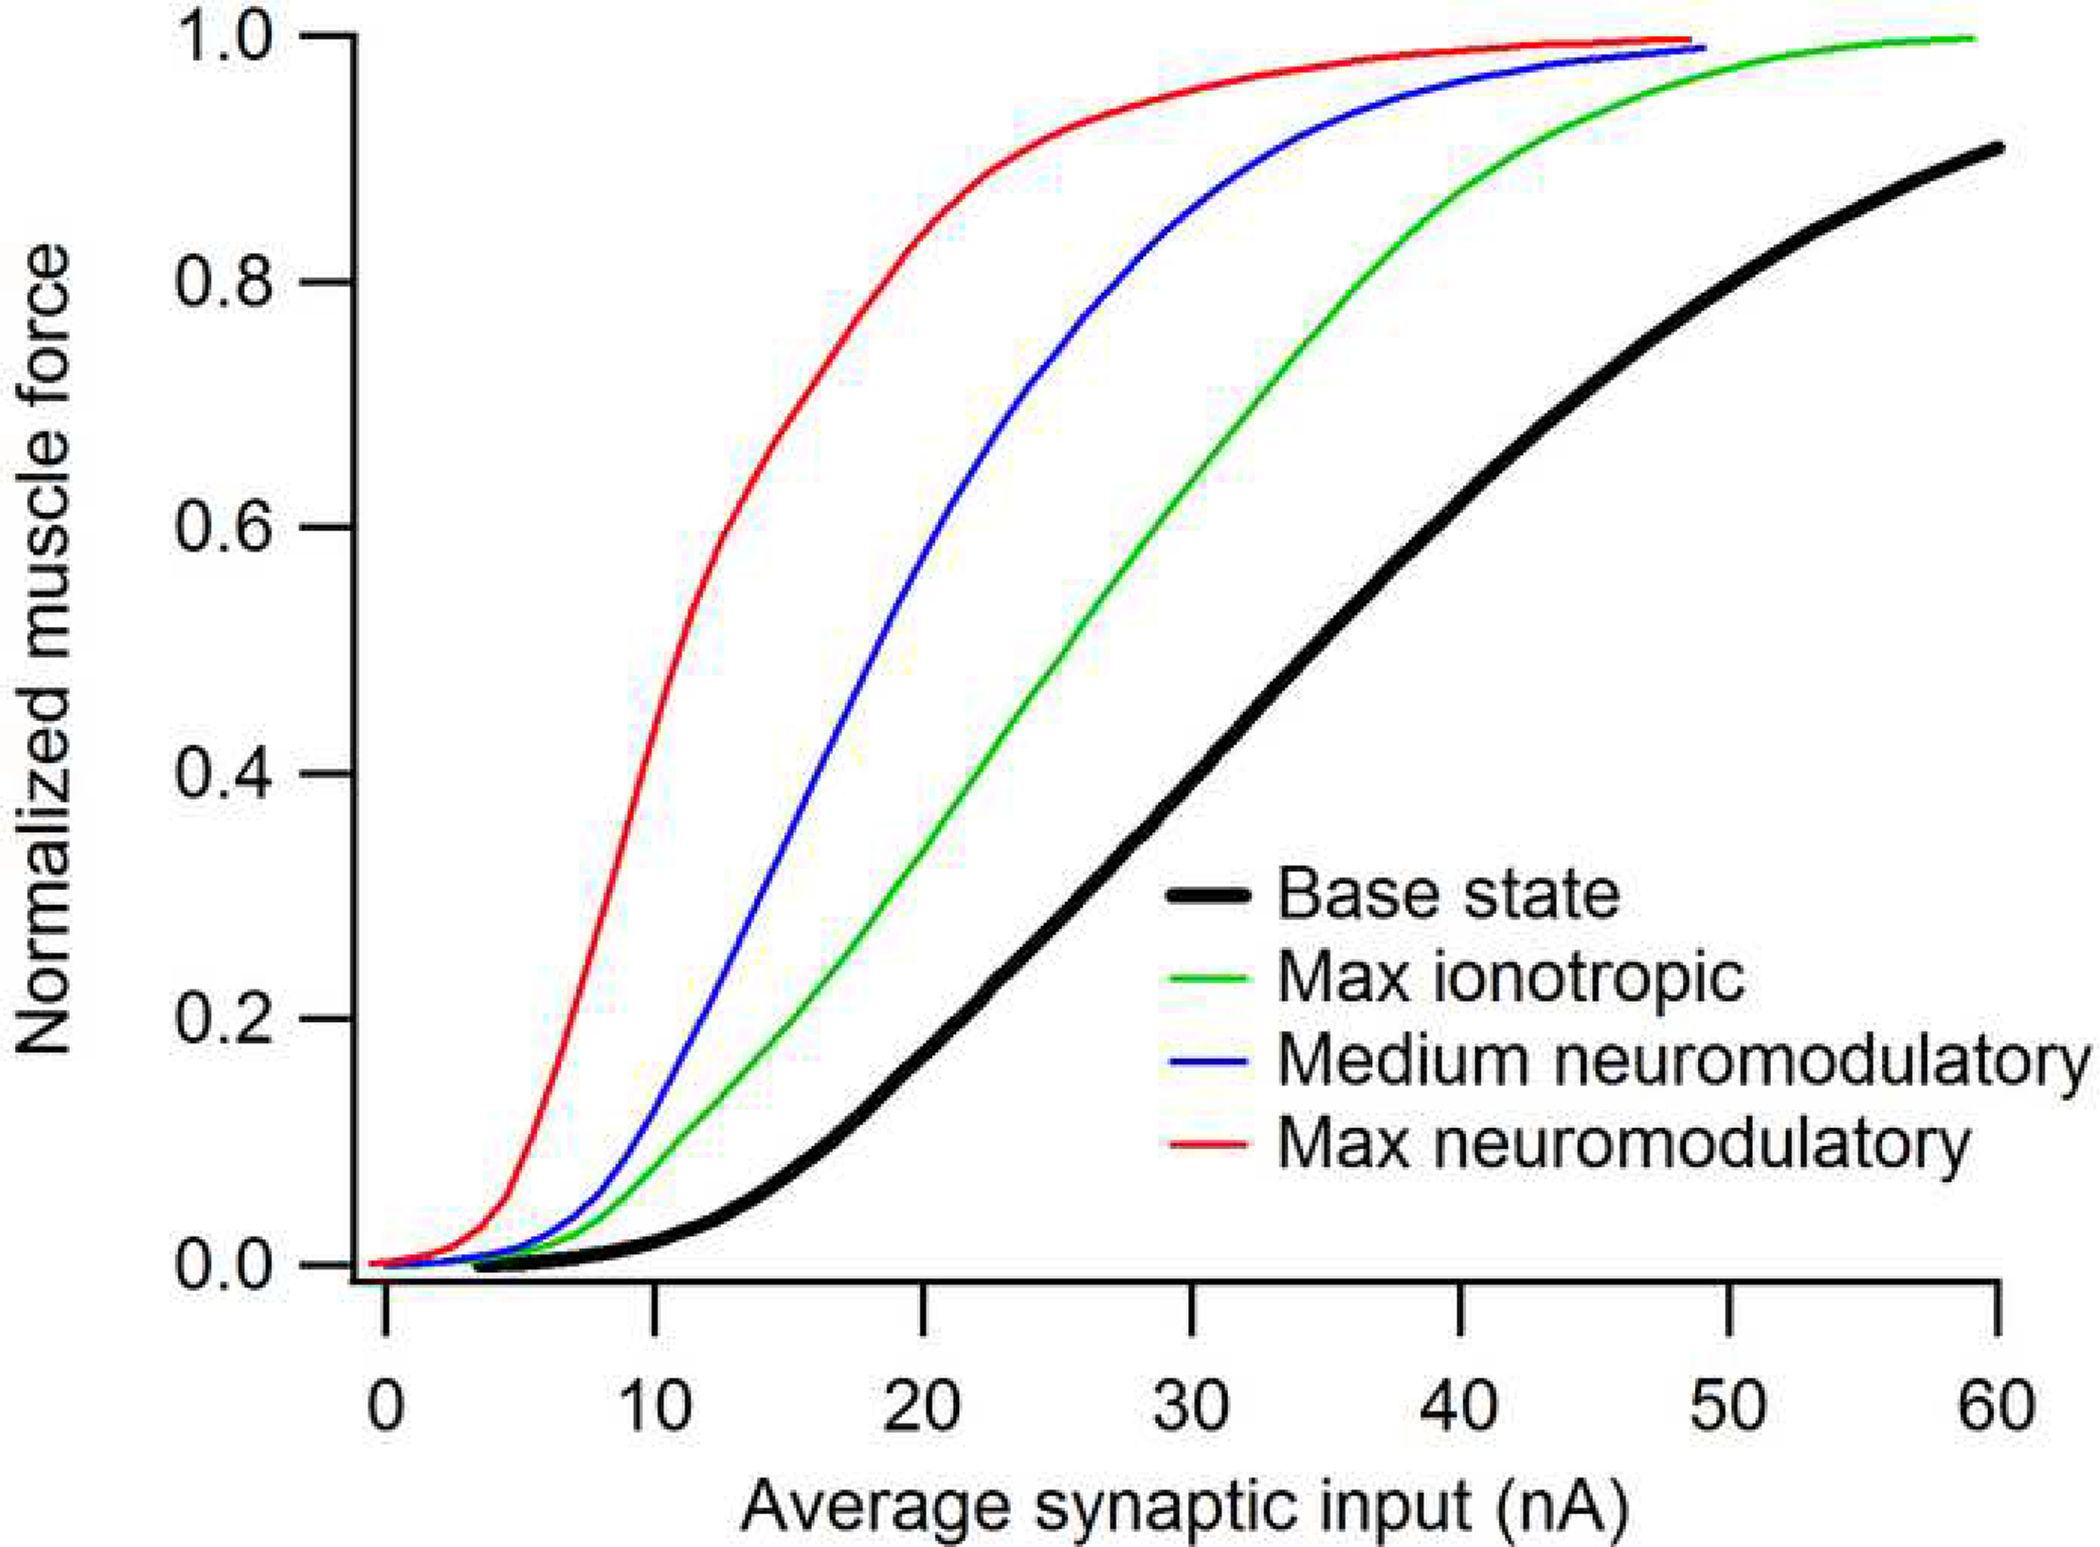
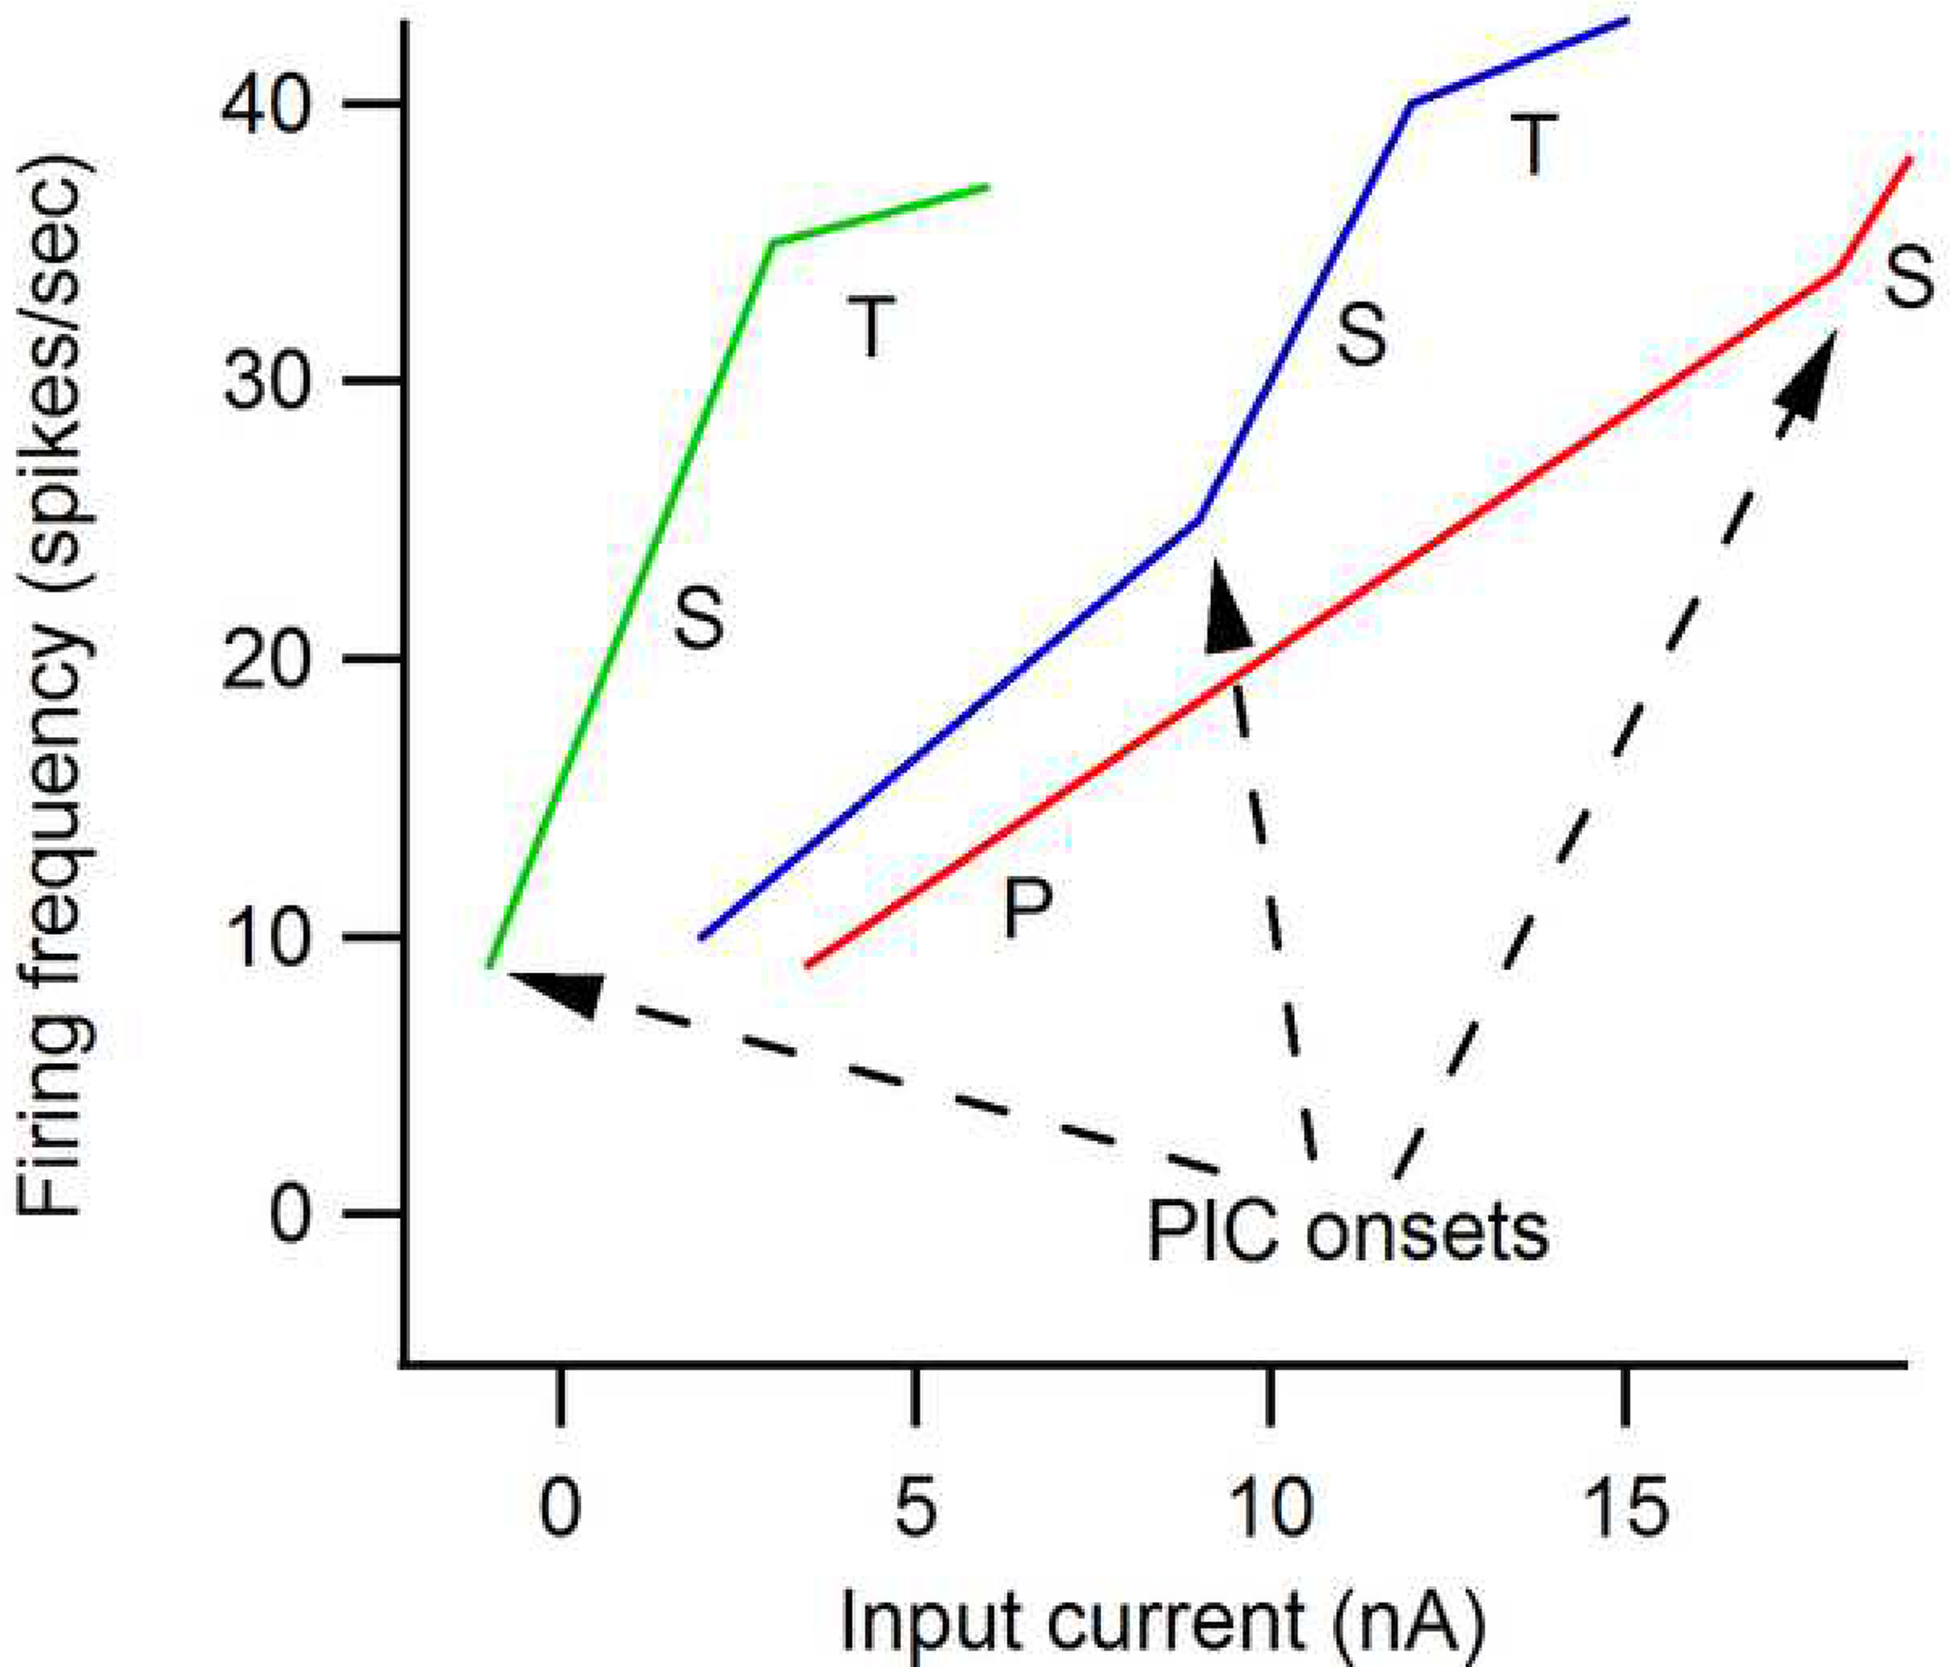
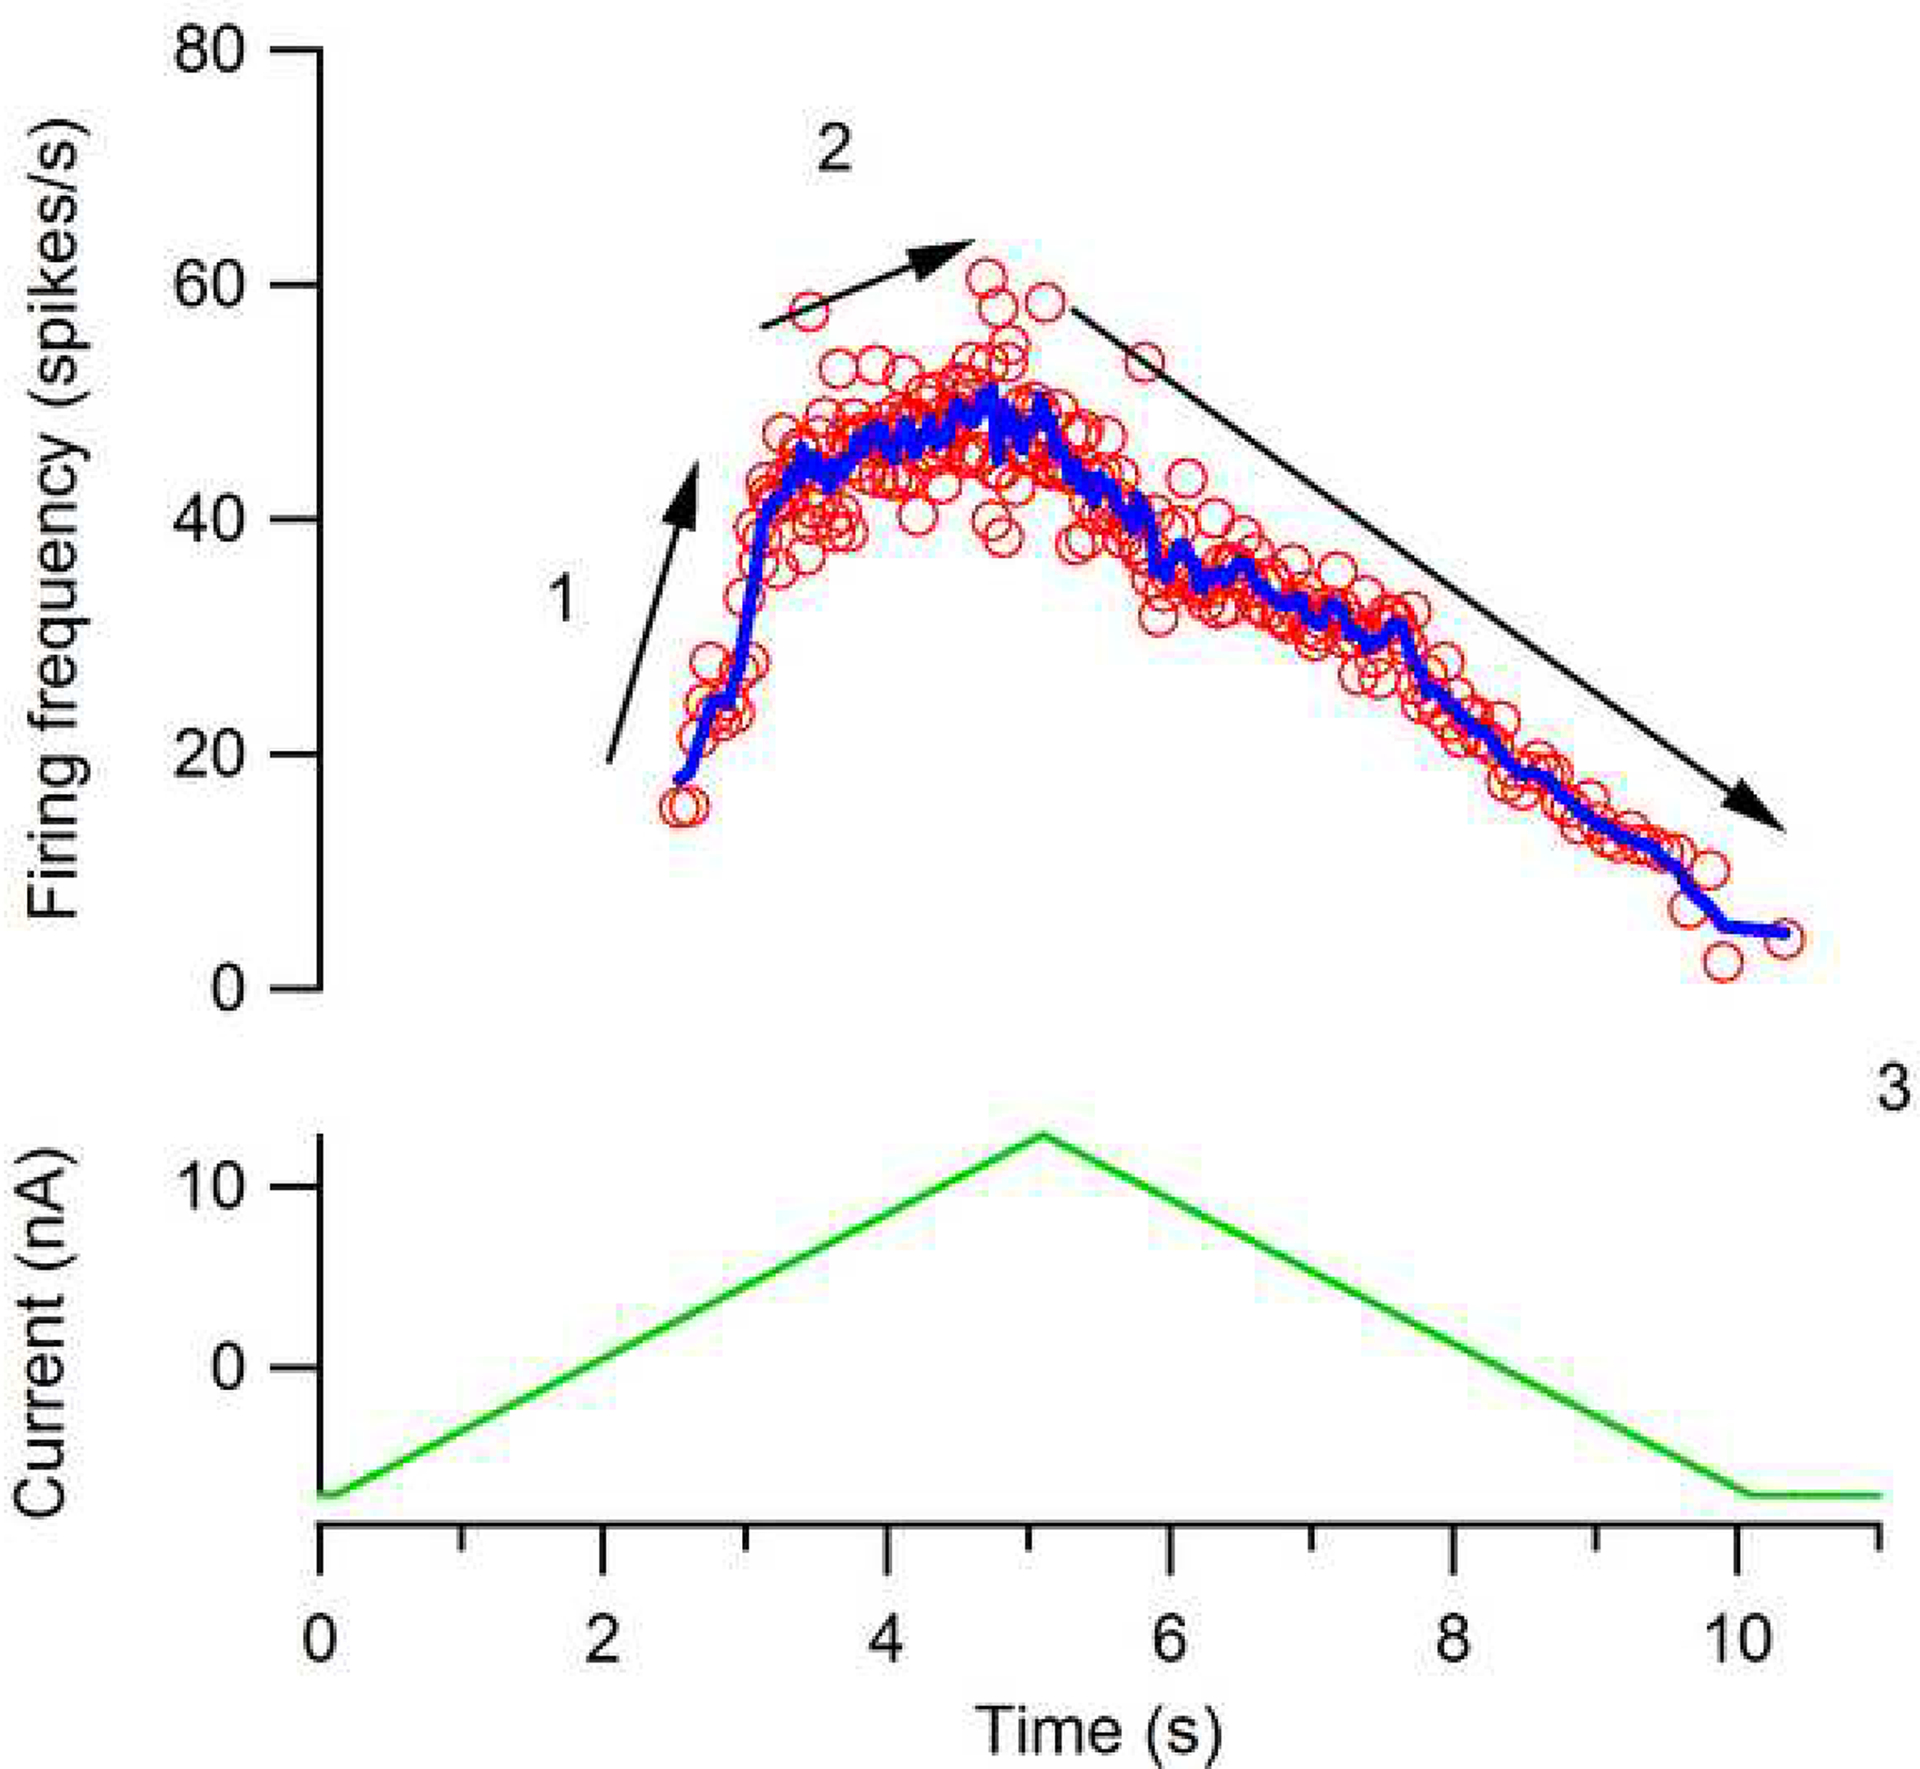
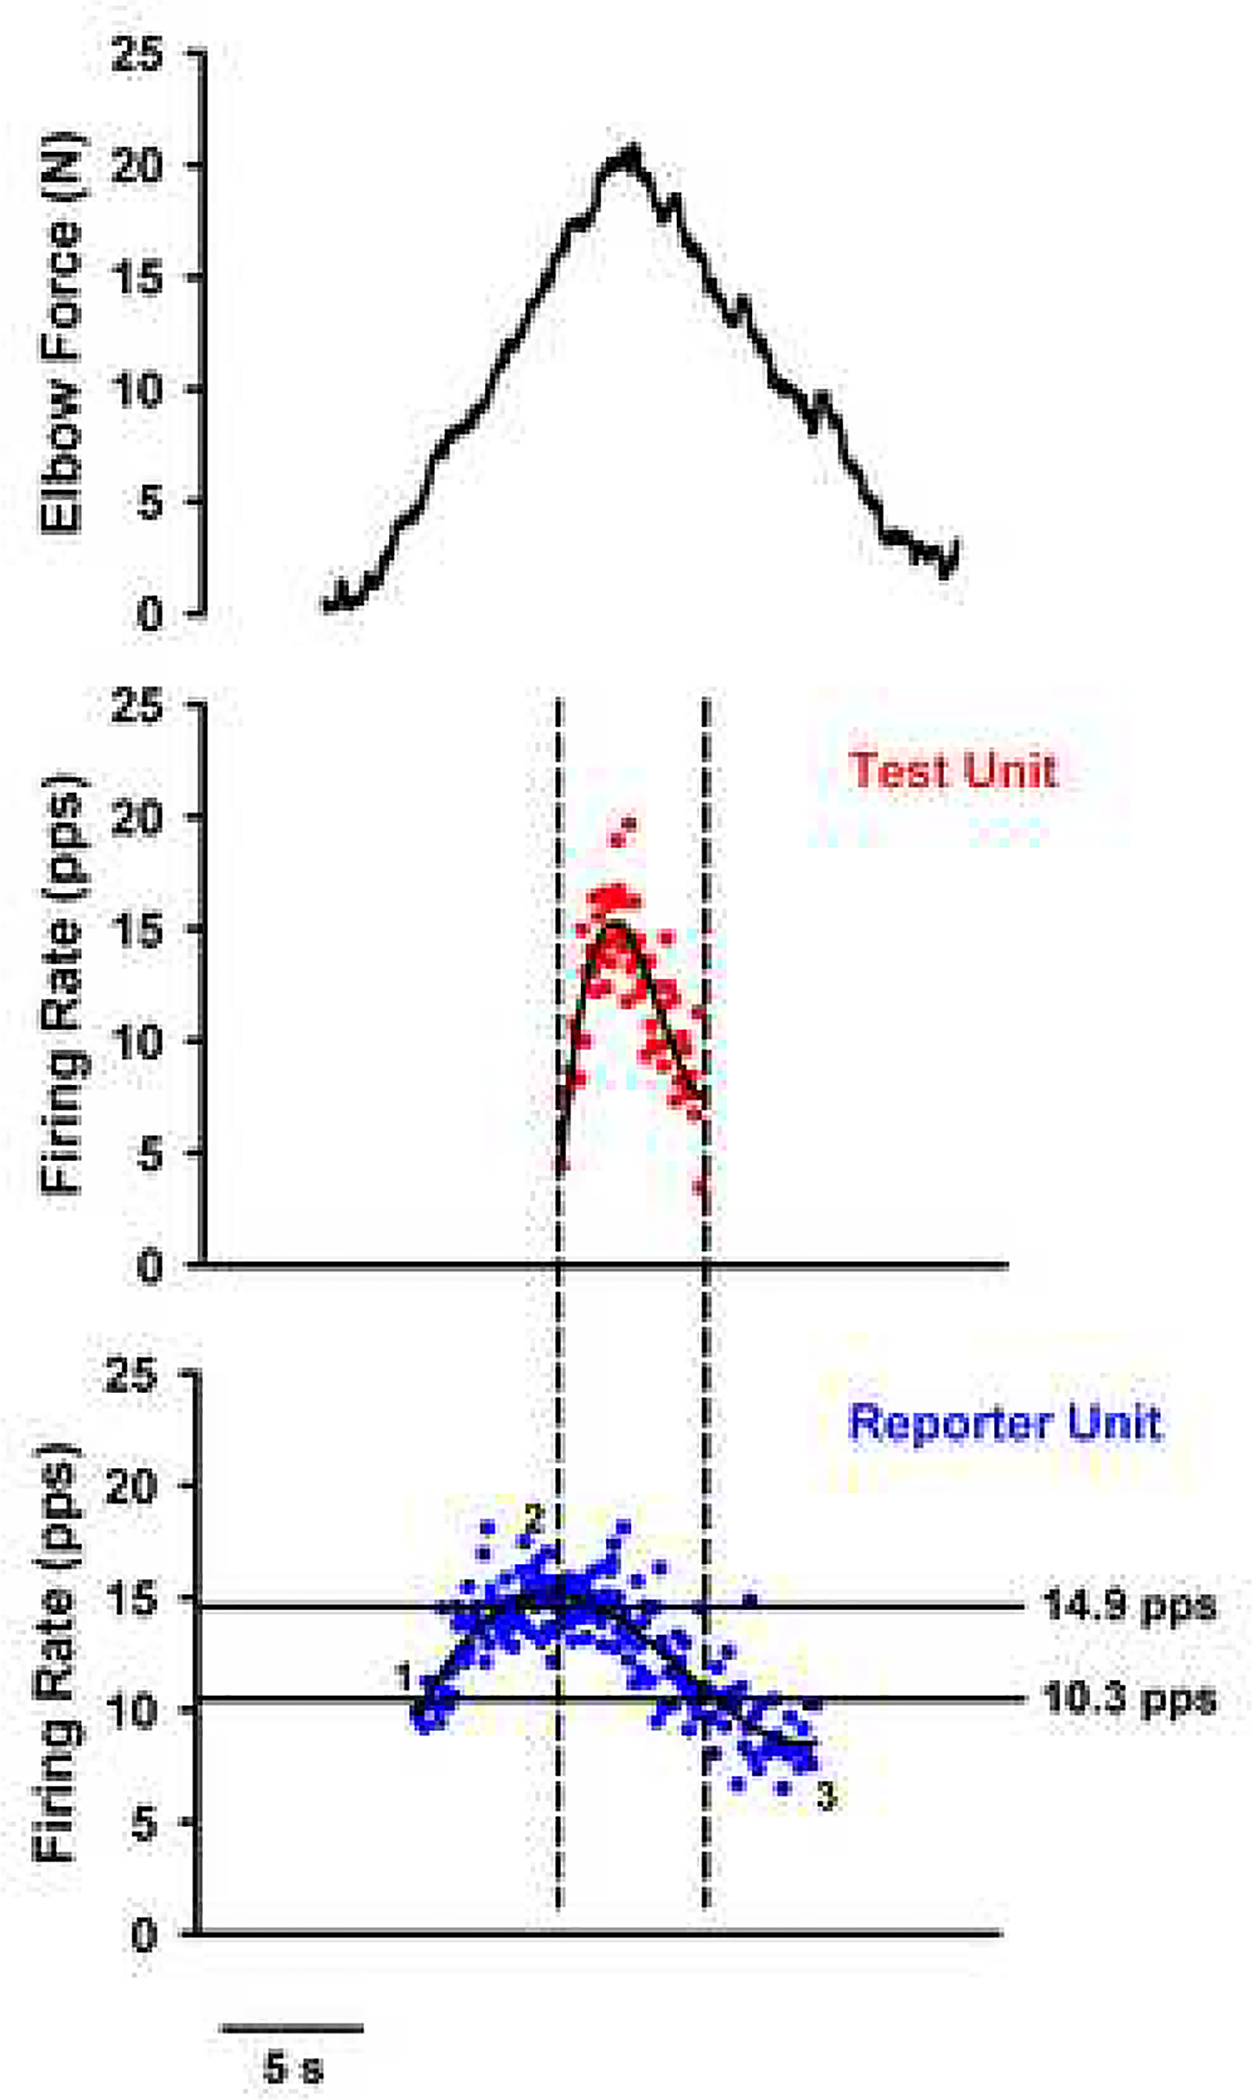
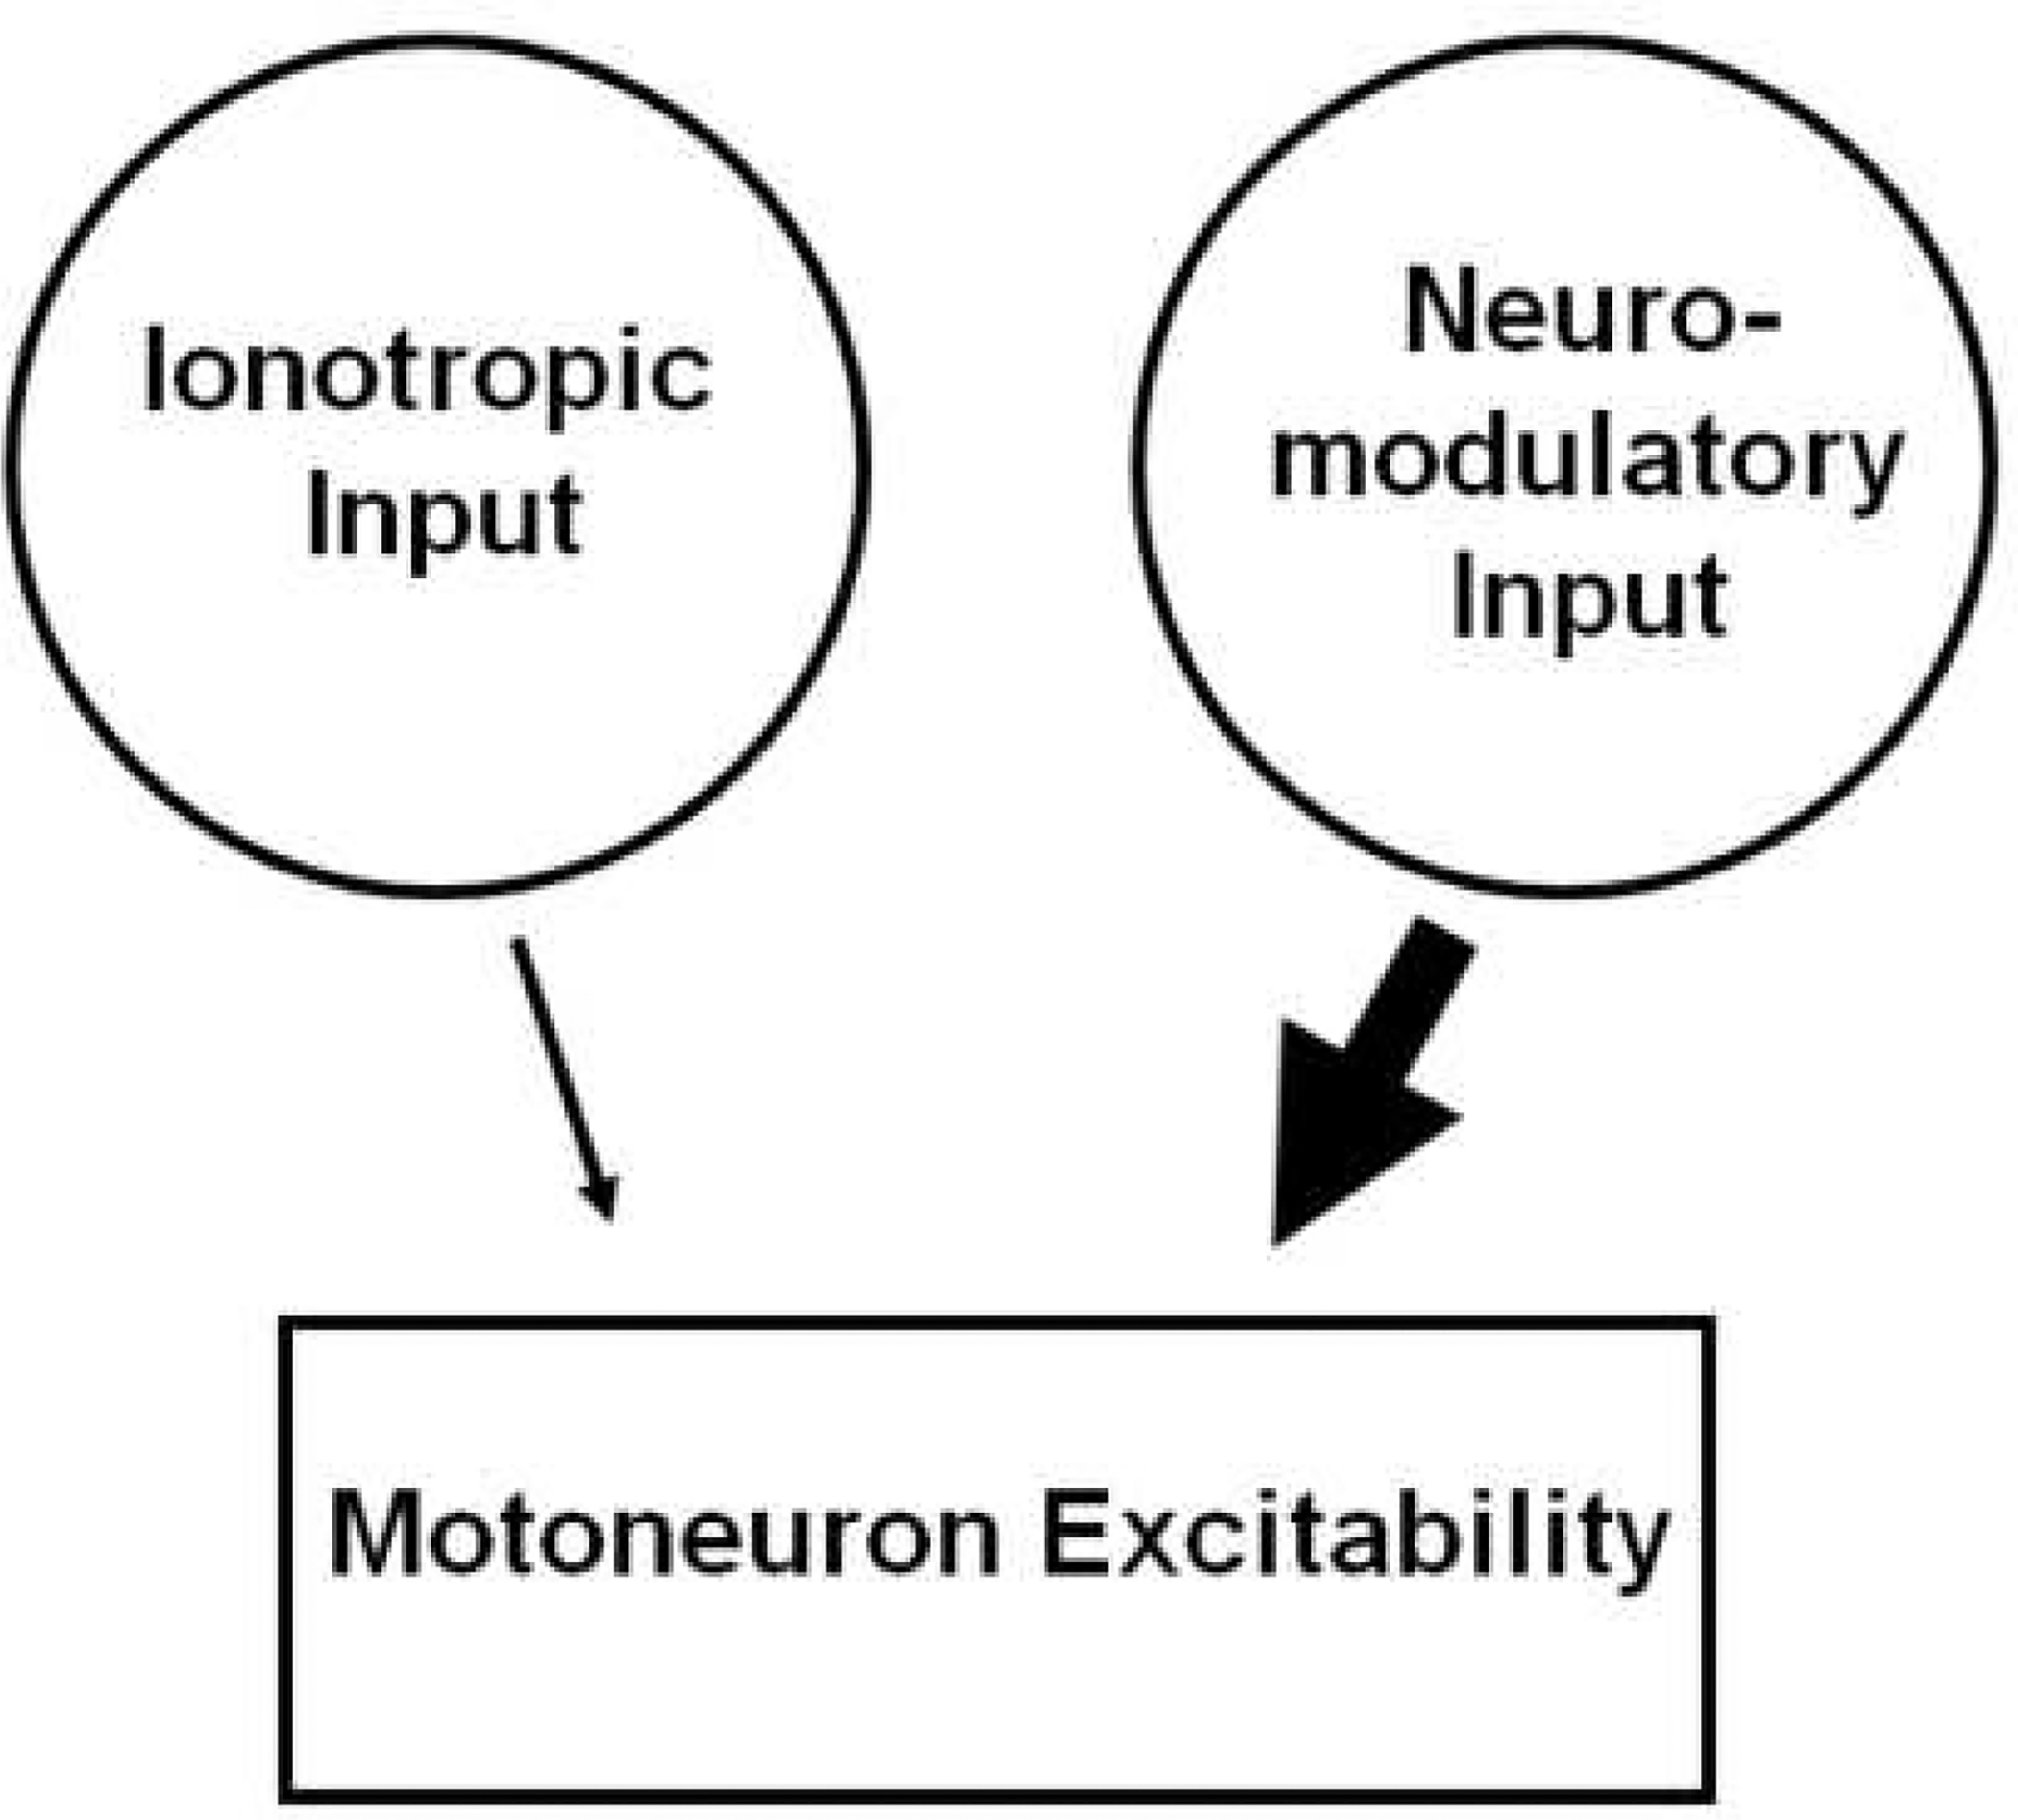
The excitability of spinal motoneurons is both fundamental for motor behavior and essential in diagnosis of neural disorders. There are two mechanisms for altering this excitability. The classic mechanism is mediated by synaptic inputs that depolarize or hyperpolarize motoneurons by generating postsynaptic potentials. This "ionotropic" mechanism works via neurotransmitters that open ion channels in the cell membrane. In the second mechanism, neurotransmitters bind to receptors that activate intracellular signaling pathways. These pathways modulate the properties of the voltage-sensitive channels that determine the intrinsic input-output properties of motoneurons. This "neuromodulatory" mechanism usually does not directly activate motoneurons but instead dramatically alters the neuron's response to ionotropic inputs. We present extensive evidence that neuromodulatory inputs exert a much more powerful effect on motoneuron excitability than ionotropic inputs. The most potent neuromodulators are probably serotonin and norepinephrine, which are released by axons originating in the brainstem and can increase motoneuron excitability fivefold or more. Thus, the standard tests of motoneuron excitability (H-reflexes, tendon taps, tendon vibration and stretch reflexes) are strongly influenced by the level of neuromodulatory input to motoneurons. This insight is likely to be profoundly important for clinical diagnosis and treatment.


Figures

Figure 1:
Figure 1:
Simplified relation between current and frequency of firing of action potentials in a motoneuron, as in seen in an animal preparation where levels of neuromodulators are very low. These frequency-current (F-I) functions are usually generated using current injected via an intracellular microelectrode. Motoneurons always exhibit a relatively sharp threshold for initiation of firing, followed by a more or less linear conversion of increasing current amplitudes to progressively higher firing rates. Thus, the F-I function provides the motoneuron with a threshold and a gain (= slope of the function). The initial portion of the function is called the primary range (P) (Kernell, 2006). At higher levels, a higher gain region known as the secondary range (S) occurs. This is the “base” form of the F-I function; neuromodulators can greatly alter this form (see text and Fig. 6).
Figure 2:
Figure 2:
Effect of the persistent inward current (PIC) on motoneuron membrane potential when action potentials are blocked (via intracellular injection of QX314, a lidocaine derivative). The PIC is manifest as a strong depolarization (vertical arrow). Note that its onset is at a more depolarized level than its offset. This hysteresis is a fundamental behavior of the Ca channel that mediates about half of the total PIC. Blue trace: membrane potential. Green trace: current injected via the microelectrode. Data from Lee and Heckman (1999b).
Figure 3:
Figure 3:
Effect of the PIC on excitatory synaptic input. The synaptic currents were measured during voltage clamp and thus, by convention, excitatory input is downwards. When the cell was clamped at a hyperpolarized level (about −90 mV in a cell with a resting potential of about −60 mV), steady activation of muscle spindle Ia afferents via tendon vibration generated a modest current with a crisp onset and offset (purple trace). In the same cell, shifting the voltage clamp to about −50 mV (the level at which firing of action potentials would occur if the cell was not voltage clamped), the very same input generated a much larger synaptic current (more than 2-fold) as well as a sustained current lasting long after the input ceased (gray arrow). Note that baseline currents have been removed to allow the traces to be superimposed. The difference between the two traces (green arrow) reflects the potent effect of the PIC. Data from Lee and Heckman (1996).
Figure 4:
Figure 4:
Typical amplification of synaptic currents generated by sustained activation of muscle spindle Ia afferents. As the background of neuromodulatory input from the brainstem is increased (low to medium to high), the peak amplitude of this ionotropic synaptic input increases 5-fold. The arrow indicates the effect of the PIC at the high level of neuromodulatory input. Data from Lee and Heckman (2000).
Figure 5
Figure 5
The effect of synaptic input on the input-output function of a motor pool and the muscle that it innervates, based on computer simulations of data for the feline medial gastrocnemius pool and muscle (Heckman and Binder, 1991, , b). The base state is simulated from data obtained in preparations where brainstem neuromodulatory input is suppressed and all motoneurons receive exactly equal proportions of synaptic input. The “Max ionotropic” effect is based the maximum sub-threshold depolarization that can be achieved without producing any motor unit recruitment and a distribution of input that favors high over low threshold units. This distribution was set as non-uniformly as possible with the the constraint that recruitment reversals should not exceed about 20% (Heckman and Binder, 1993b). Medium and Max neuromodulatory effects are based on studies where the brainstem is highly active and where this activity is supplemented by an exogenous monoaminergic agonist (Lee and Heckman, 1998a, b, 1999a).
Figure 6:
Figure 6:
Transformation of the motoneuron frequency-current (F-I) function by neuromodulatory input. As monoaminergic input from the brainstem increases from low (red trace) to medium (blue) to high (green), the threshold of the cell is lowered markedly. In addition the PIC becomes larger and its threshold is lowered. As a result, the primary range disappears and firing is dominated by the PIC. There is an initial acceleration in firing (the secondary range) followed by a more shallow but usually still positive tertiary range (this phenomenon has variously been referred to as rate limiting, saturation and the “preferred” firing range).
Figure 7:
Figure 7:
A typical relation between input and firing for a feline motoneuron with a strong PIC. Each of the phases labeled 1 through 3 has been detected in human motor unit firing patterns. 1: Initial acceleration (secondary range). 2: Preferred firing range (i.e. tertiary range or rate limiting). 3: Offset at a lower input than onset (i.e. hysteresis). A de-acceleration in firing rate is sometimes evident right at de-recruitment - see Fig. 8.
Figure 8:
Figure 8:
Example of human motor unit firing patterns from a pair of motor units in the biceps brachii of a healthy subject. On the lowest panel, the “reportor” unit exhibits the same firing behaviors as in the motoneuron in Fig. 7: 1: Initial acceleration, 2: Preferred firing range and 3: Hysteresis. Note also there is de-acceleration at de-recruitment. This figure also illustrates the paired motor unit method for estimating PIC amplitude. Vertical dashed lines indicate times of recruitment and de-recruitment of the higher-threshold (test) unit; horizontal lines indicate the corresponding lower-threshold (reporter) unit firing rates (estimate of synaptic input to test unit) at these times. The lower-threshold (reporter) unit provides an estimate of average synaptic drive and thus the differences in its frequency of firing (Δ F) at recruitment vs. . Top panel, black: Volitional elbow flexion force in N (y-axis) in relation to time (x-axis); middle panel, red: firing rates of Test Unit in pulses per second (y-axis) in relation to time (x-axis), average in black; bottom panel, blue: firing rates of Reporter Unit in pulses per second (y-axis) in relation to time (x-axis), average in black.Note Δ F for this subject was 4.6 Hz. Unpublished data from Mottram.
Figure 9:
Figure 9:
Motoneuron excitability is controlled by two types of synaptic input, ionotropic and neuromodulatory input. As indicated by the size of the arrows, the neuromodulatory system has a more powerful effect.

References

    1. Alaburda A, Perrier JF, Hounsgaard J (2002) Mechanisms causing plateau potentials in spinal motoneurones. Adv Exp Med Biol 508:219–226. - PubMed
    1. Alvarez FJ, Fyffe RE (2007) The continuing case for the Renshaw cell. J Physiol 584:31–45. - PMC - PubMed
    1. Alvarez FJ, Pearson JC, Harrington D, Dewey D, Torbeck L, Fyffe RE (1998) Distribution of 5-hydroxytryptamine-immunoreactive boutons on alpha- motoneurons in the lumbar spinal cord of adult cats. J Comp Neurol 393:69–83. - PubMed
    1. Amendola J, Durand J (2008) Morphological differences between wild-type and transgenic superoxide dismutase 1 lumbar motoneurons in postnatal mice. J Comp Neurol 511:329–341. - PubMed
    1. Aston-Jones G, Cohen JD (2005) An integrative theory of locus coeruleus-norepinephrine function: adaptive gain and optimal performance. Annu Rev Neurosci 28:403–450. - PubMed

Publication types

MeSH terms

Substances