. 2009 Dec;20(10):471-6.
doi: 10.1016/j.tem.2009.06.007. Epub 2009 Sep 23.

Systems biology asks new questions about sex differences

Affiliations

Systems biology asks new questions about sex differences

Arthur P Arnold et al. Trends Endocrinol Metab. 2009 Dec.

Abstract

Females and males differ in physiology and in the incidence and progression of diseases. The sex-biased proximate factors causing sex differences in phenotype include direct effects of gonadal hormones and of genes represented unequally in the genome because of their X- or Y-linkage. Novel systems approaches have begun to assess the magnitude and character of sex differences in organization of gene networks on a genome-wide scale. These studies identify functionally related modules of genes that are coexpressed differently in males and females, and sites in the genome that regulate gene networks in a sex-specific manner. Measurement of the aggregate behavior of genes uncovers novel sex differences that can be related more effectively to susceptibility to disease.


Figures
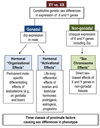
Figure 1
Figure 1
Genetic and proximate factors causing sex differences in phenotype. All sex differences in phenotype arise at the genetic level because of the sexual imbalance of genes encoded on the sex chromosomes. The expression of Sry in the undifferentiated male gonad causes differentiation of the testes, which sets up lifelong sex differences in the secretion of gonadal sex steroid hormones. These hormones have two types of effects, permanent differentiating (“organizational”) effects on genitalia, brain, and perhaps other tissues, and differences in the acute (“activational”) effects of ovarian and testicular hormones. In addition, Sry and other X and Y genes have sex-biased differential effects (“sex chromosome effects”) within non-gonadal cells that differ between the two sexes [4,5].
Figure 2
Figure 2
Two orthogonal views of modules of co-expressed genes leads to identification of a new class of sex-biased genes. Genome-wide microarray analysis of liver gene co-expression leads to the identification of several groups (modules) of genes that show correlated expression across mice [25]. Individual dots represent genes in two modules, colored cyan and green, graphed according to two of their attributes. The difference in expression of each gene in males vs. females is indicated on the Y axis as the t-test statistic comparing male and female, with positive t-scores indicating higher expression in males. Thresholds for significantly different expression in males and females are shown by the horizontal lines, so that sectors 1–3 show higher expression in males, and sectors 5–7 show higher expression in females. The difference in connectivity of the genes within gene networks is shown on the X axis as the difference (in females vs. males) in the connectivity statistic k, which is a function of the summed pairwise correlations of the expression level of that gene with expression of each other gene across animals [22]. Thresholds for significance are shown by the vertical lines. Greater connectivity in males (sectors 1,7, and 8) results in negative k difference scores, and greater connectivity in females gives positive k difference scores (sectors 3–5). This two-dimensional analysis reveals a previously unknown subset of cyan module genes in sector 1 that are expressed higher in males and are better connected in males. The cyan module is unusually enriched in genes whose expression is sensitive to androgen levels in adults [25]. The expression of the green module is strongly correlated with the amount of body fat in female mice but uncorrelated with that in males. This combined use of several orthogonal analyses therefore leads to the identification of groups of genes with similar response to sex-specific factors.
Figure 3
Figure 3
Gene co-expression analysis shows sex differences in gene networks in adult mouse liver. The figure is a simplified visual summary of sex differences in the organization of the cyan module of gene expression in liver of (a) females and (b) males. Genes (nodes) in the network are represented as dots, and the correlation between expression of genes is represented as lines (network edges). Large dots indicate genes with more than 40 connections in the module, and smaller dots genes with fewer than 40 connections. Modules are defined in females and compared to males. Most other modules defined based on co-expression in females are also found in males. In the liver cyan module, however, a significant number of genes were more connected in males (more large dots) and showed higher expression in males (Figure 2). Other data indicates that expression of a disproportionate number of cyan module genes was sensitive to the level of androgen [25]. Copyright 2009, The Endocrine Society.

References

    1. Perrot-Sinal TS. Do these genes make me look fat? Endocrinol. 2009;150:1075–1077. - PubMed
    1. Ober C, et al. Sex-specific genetic architecture of human disease. Nat. Rev. Genet. 2008;9:911–922. - PMC - PubMed
    1. Arnold AP. Sex chromosomes and brain gender. Nat. Rev. Neurosci. 2004;5:701–708. - PubMed
    1. Becker JB, et al. Strategies and methods for research on sex differences in brain and behavior. Endocrinol. 2005;146:1650–1673. - PubMed
    1. Arnold AP. Mouse models for evaluating sex chromosome effects that cause sex differences in non-gonadal tissues. J. Neuroendocrinol. 2009;21:377–386. - PMC - PubMed

Publication types