. 2009 Nov;37(21):7219-30.
doi: 10.1093/nar/gkp794.

The single polypeptide restriction-modification enzyme LlaGI is a self-contained molecular motor that translocates DNA loops

Affiliations

The single polypeptide restriction-modification enzyme LlaGI is a self-contained molecular motor that translocates DNA loops

Rachel M Smith et al. Nucleic Acids Res. 2009 Nov.

Abstract

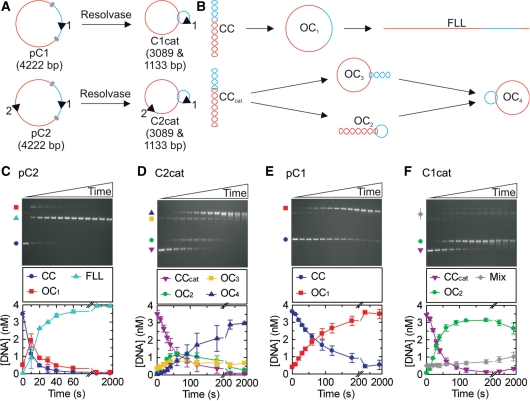
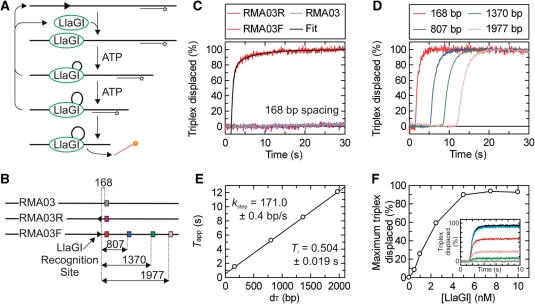
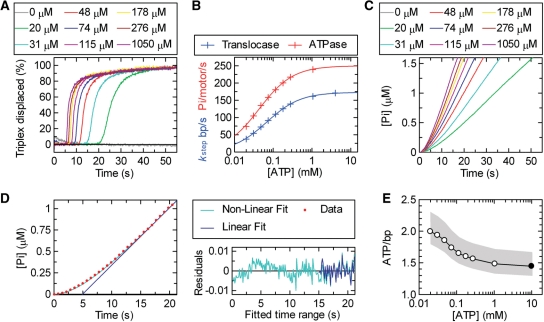
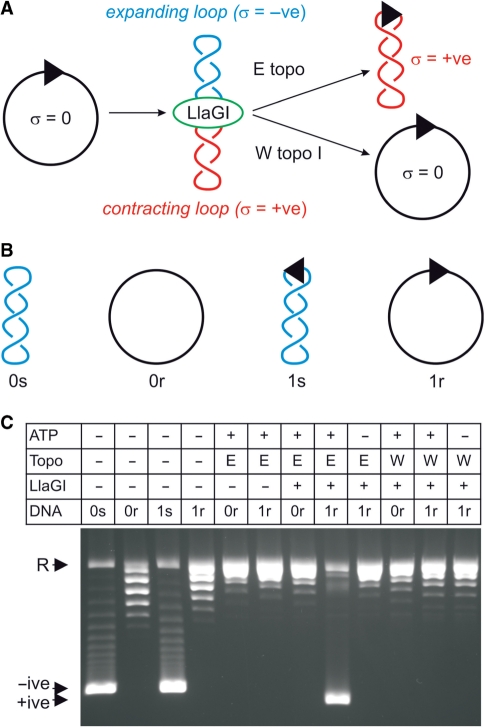
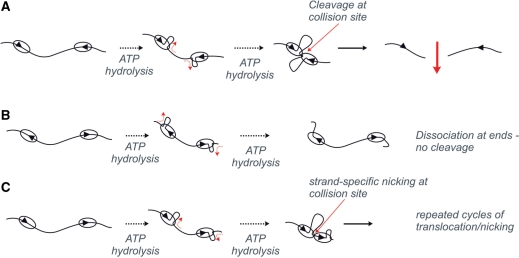
To cleave DNA, the single polypeptide restriction-modification enzyme LlaGI must communicate between a pair of indirectly repeated recognition sites. We demonstrate that this communication occurs by a 1-dimensional route, namely unidirectional dsDNA loop translocation rightward of the specific recognition sequence 5'-CTnGAyG-3' as written (where n is either A, G, C or T and y is either C or T). Motion across thousands of base pairs is catalysed by the helicase domain and requires the hydrolysis of 1.5-2 ATP per base pair. DNA loop extrusion is accompanied by changes in DNA twist consistent with the motor following the helical pitch of the polynucleotide track. LlaGI is therefore an example of a polypeptide that is a completely self-contained, multi-functional molecular machine.


Figures

Figure 1.
Figure 1.
LlaGI endonuclease activity measured on DNA catenanes. (A) The two plasmid substrates used to form catenanes in the presence of Tn21 resolvase. LlaGI recognition sequences are represented as arrowheads where the orientation is 5′-CTnGAyG-3′. Res sites for Tn21 resolvase are shown as grey blocks whilst the different DNA domains that are separated by recombination are shown in red and blue. (B) Possible DNA species formed when LlaGI is incubated with the plasmid or catenane substrates. Each arrow represents the cleavage of one DNA strand. CC, covalently closed circular DNA (negatively supercoiled); OC1, open circle DNA (‘nicked’); FLL, full-length linear DNA; CCcat, covalently closed circular catenane DNA. For the catenanes, OC2 is nicked in the small ring only, OC3 is nicked in the large ring only and OC4 is nicked in both rings. Example gels and average cleavage profiles are shown for: (C) two-site plasmid DNA pC2; (D) two-site catenane DNA C2cat; (E) one-site plasmid DNA pC1; and (F) one-site catenane DNA C1cat. Reactions contained 200 nM LlaGI, 4 nM DNA and 4 mM ATP (‘Materials and Methods’ section). ‘Mix’ in (F) represents the combination of OC3, OC4 and dimeric DNA products. Time points were collected at 0, 10, 20, 30, 40, 60, 90, 120, 180, 300, 600, 1200 and 1800 s.
Figure 2.
Figure 2.
LlaGI translocase activity measured using the DNA triplex displacement assay. (A) Schematic of the translocation assay showing substrate binding, translocation and triplex displacement. DNA is shown as a thick line, the LlaGI binding site is shown as an arrowhead as in Figure 1, the TFO is shown as a line with a star indicating the position of the TAMRA label and LlaGI is shown as a green oval. It is assumed in this sketch that LlaGI is a DNA loop translocase—this is demonstrated in Figure 4. (B) DNA substrates for the triplex assays: a substrate without a LlaGI site (RMA03), and two 1-site substrates in which the LlaGI site faces either away (RMA03R) or towards (RMA03F) the TBSs. The distances (bp) between the LlaGI site (arrowhead) and the TBSs (coloured squares) are indicated. For clarity, only one of the four TBSs is shown on RMA03 and RMA03R. (C) Triplex displacement is dependent upon the LlaGI sequence. The three DNA substrates (at 1 nM) with the 168-bp spacing triplex bound (0.5 nM) were pre-incubated with LlaGI (100 nM) and translocation initiated by mixing with 4 mM ATP. Triplex displacement is only observed on RMA03F, where the LlaGI site faces towards the TBSs (as defined by the arrowhead). The black line through the RMA03F data represents the fitted line from Equation (1). (D) The rate of triplex displacement is distance dependent. The translocation of LlaGI on RMA03F was investigated individually for each of the four triplex spacings as indicated. Reaction conditions as in (C). (E) The reaction profiles in (D) were fitted to Equation (1) to obtained an estimate of Tapp (not shown). A linear fit of the relationship between Tapp and distances [Equation (2)] gives kstep and Ti. (F) The dependence of triplex displacement on LlaGI concentration. 1 nM RMA03F bound by 0.5 nM 168 bp triplex was incubated with varying concentrations of LlaGI and the reaction initiated by adding 4 mM ATP. (inset) Triplex displacement time course profiles at (from bottom to top) 0, 0.5, 1.0, 2.5, 5.0 and 7.5 nM LlaGI. (Main graph) Relationship of the maximum triplex displaced as a function of LlaGI concentration. Maximum values were calculated from the total amplitudes of the exponential fits.
Figure 3.
Figure 3.
The coupling of ATP hydrolysis to DNA translocation. (A) Translocation profiles measured using triplex displacement at different ATP concentrations as indicated using 1 nM RMA03F (0.5 nM 807 bp triplex) and 10 nM LlaGI. By using data collected at each ATP concentration for each of the triplex spacings, kstep was calculated as in Figure 2E (data not shown). (B) The relationship between kstep (blue) and kATP (red) as a function of ATP concentration. The solid lines represent least-squares fits to Equation (3). (C) Steady-state phosphate release measured using the PBP assay (‘Materials and Methods’ section); 0.5 nM RMA03F was pre-incubated with 10 nM LlaGI and the reaction initiated with ATP at the concentrations indicated. Profiles have been corrected for a non-specific background measured on RMA03 (data not shown). (D) Example of the fits used to estimate the ATPase rate (V) from the phosphate release data. For clarity, a reduced number of data points (red circles) are shown for the 48 µM profile from (C). Fitting was carried out using the complete data set. The data was fitted to both Equation (4) (green line) and Equation (5) (blue line). The residuals for each fit are shown. There are systematic non-random variations from Equation (4) during the initiation phase, whilst both equations return the same linear fit beyond 15 s (see text for more details). kATP was calculated from the linear steady-state rate (V) assuming one active motor per DNA molecule. (E) The coupling of ATP to translocation. The measured and fitted values for kATP were divided by the corresponding kstep values to give the apparent number of ATP molecules hydrolysed per base pair translocated as a function of ATP concentration. The filled circle indicates the value calculated using the Vmax values from (B). The grey shading indicates the extent of the estimated error range (‘Materials and Methods’ section).
Figure 4.
Figure 4.
LlaGI produces transient changes in DNA supercoiling consistent with loop translocase activity. (A) Schematic of the topoisomerase assay (48). DNA and enzyme shown as in previous figures. See main text for further details. (B) The four different starting substrates for the topology assay derived from pRMA03 and pRMA03F (‘Materials and Methods’ section). 0s is zero-site supercoiled, 0r is zero-site relaxed, 1s is one-site supercoiled and 1r is one-site relaxed. (C) LlaGIDA078, a nuclease mutant of LlaGI (38), was used to prevent DNA cleavage. Reactions contained 10 nM DNA and, as indicated, 4 mM ATP, 5 U E. coli topoisomerase I (E), 10 U wheat germ topoisomerase I (W) and/or 50 nM LlaGIDA078. Reactions were incubated for 30 min at 37°C and separated by agarose gel electrophoresis.
Figure 5.
Figure 5.
How DNA translocation by LlaGI leads to DNA cleavage. The consequences of unidirectional loop translocation by LlaGI are shown for linear DNA with two sites in: (A) head-to-head repeat; (B) tail-to-tail repeat; and (C) head-to-tail repeat. See main text for full details.

References

    1. Winkler FK, Prote AE. Structure and function of EcoRV endonuclease in restriction enzymes. In: Pingound A, editor. Nucleic Acids and Molecular Biology. Vol. 14. Germany: Springer; 2004. pp. 179–210.
    1. Gowers DM, Bellamy SR, Halford SE. One recognition sequence, seven restriction enzymes, five reaction mechanisms. Nucleic Acids Res. 2004;32:3469–3479. - PMC - PubMed
    1. Bourniquel AA, Bickle TA. Complex restriction enzymes: NTP-driven molecular motors. Biochimie. 2002;84:1047–1059. - PubMed
    1. Halford SE, Welsh AJ, Szczelkun MD. Enzyme-mediated DNA looping. Annu. Rev. Biophys. Biomol. Struct. 2004;33:1–24. - PubMed
    1. Szczelkun MD, Halford SE. Recombination by resolvase to analyse DNA communications by the SfiI restriction endonuclease. EMBO J. 1996;15:1460–1469. - PMC - PubMed

Publication types

MeSH terms