. 2009 Nov;37(21):7268-80.
doi: 10.1093/nar/gkp787.

tRNA over-expression in breast cancer and functional consequences

Affiliations

tRNA over-expression in breast cancer and functional consequences

Mariana Pavon-Eternod et al. Nucleic Acids Res. 2009 Nov.

Abstract

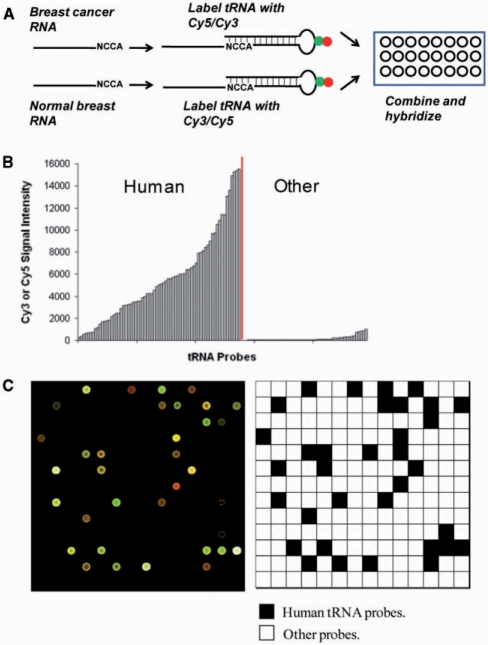
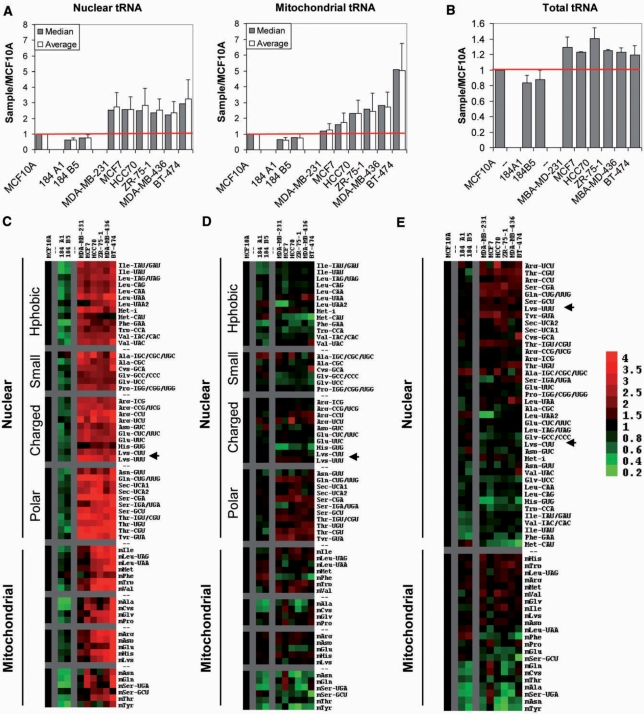
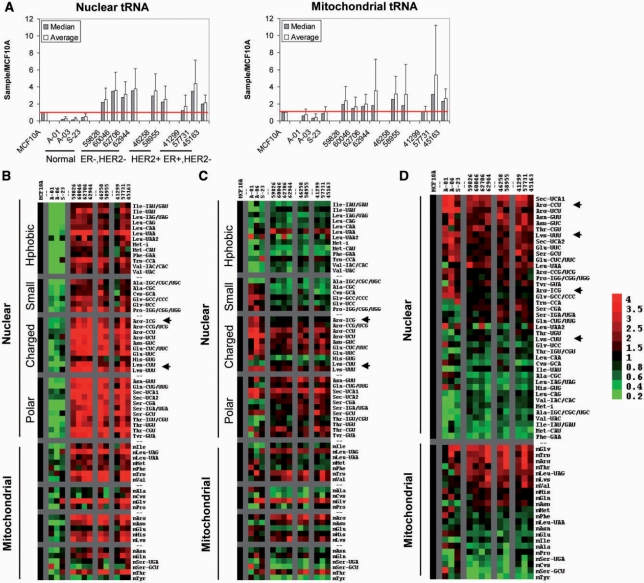
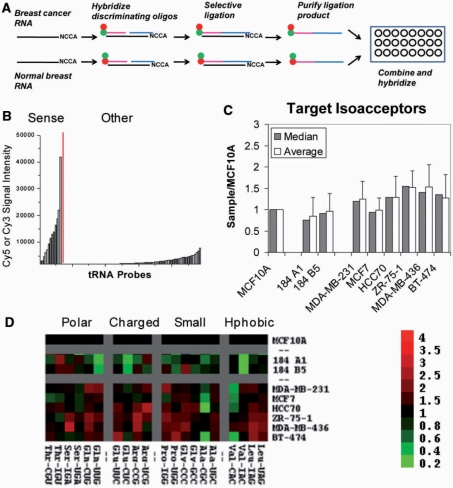
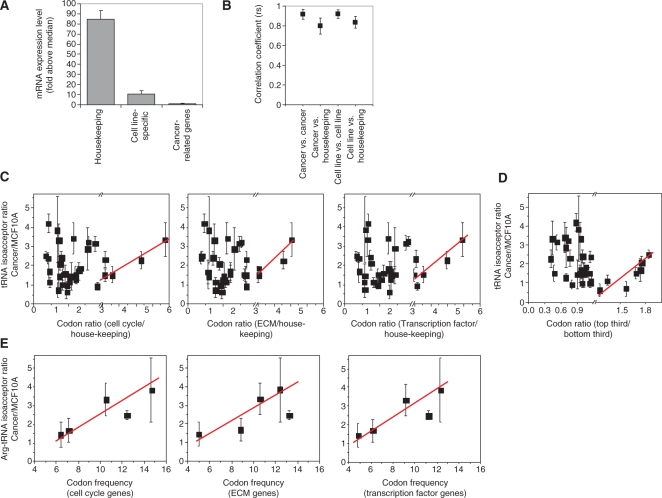
Increased proliferation and elevated levels of protein synthesis are characteristics of transformed and tumor cells. Though components of the translation machinery are often misregulated in cancers, what role tRNA plays in cancer cells has not been explored. We compare genome-wide tRNA expression in cancer-derived versus non-cancer-derived breast cell lines, as well as tRNA expression in breast tumors versus normal breast tissues. In cancer-derived versus non-cancer-derived cell lines, nuclear-encoded tRNAs increase by up to 3-fold and mitochondrial-encoded tRNAs increase by up to 5-fold. In tumors versus normal breast tissues, both nuclear- and mitochondrial-encoded tRNAs increase up to 10-fold. This tRNA over-expression is selective and coordinates with the properties of cognate amino acids. Nuclear- and mitochondrial-encoded tRNAs exhibit distinct expression patterns, indicating that tRNAs can be used as biomarkers for breast cancer. We also performed association analysis for codon usage-tRNA expression for the cell lines. tRNA isoacceptor expression levels are not geared towards optimal translation of house-keeping or cell line specific genes. Instead, tRNA isoacceptor expression levels may favor the translation of cancer-related genes having regulatory roles. Our results suggest a functional consequence of tRNA over-expression in tumor cells. tRNA isoacceptor over-expression may increase the translational efficiency of genes relevant to cancer development and progression.


Figures

Figure 1.
Figure 1.
tRNA overexpression in breast cancer cells. (A) Fluorescence labeling scheme of tRNA in total RNA samples. (B) Fluorescence intensity of a human total RNA sample hybridized to the array. “Human” indicates signals for the designated human tRNA probes, “other” signals for bacterial tRNA probes (no signal expected). (C) One of the 48 blocks from a standard tRNA microarray hybridized with MCF10A (Cy5) and MCF7 (Cy3). The schematic indicates the position of human tRNA probes (black) and other probes (white, include ribosomal RNA and bacterial tRNA probes).
Figure 2.
Figure 2.
Relative abundance of nuclear and mitochondrial encoded tRNAs in breast cancer cells. Data is shown for three breast epithelial cell lines (MCF10A, 184 A1, 184 B5) and six breast cancer cell lines (MDA-MB-231, MCF7, HCC70, ZR-75-1, MDA-MB-436, BT-474), all relative to MCF10A. (A) Mean and median values of the nuclear (left) and mitochondrial (right) encoded tRNAs. (B) Total tRNA quantified by agarose gel electrophoresis for all samples. All RNAs are detected by ethidium bromide staining and quantified using a PharosFX Molecular Imager. Fraction of total tRNA was measured relative to the non-tRNA bands in the same lane, and then normalized to that of MCF10A. (C) Expression of nuclear and mitochondrial encoded tRNAs shown as TreeView image. All values are relative to MCF10A. Green indicates a decreased level of expression; red indicates an increased level of expression relative to MCF10A. Data are grouped according to amino acid type. (D) Expression of nuclear and mitochondrial encoded tRNAs normalized to median shown as TreeView image. All values are relative to MCF10A and normalized to the median value for each sample. Green indicates a decreased level of expression; red indicates an increased level of expression relative to median. Data are grouped according to corresponding amino acid type. (E) Same as (D), data are grouped from high to low expression.
Figure 3.
Figure 3.
tRNA over-expression in breast cancer in vivo. Data is shown for three normal breast tissue samples (A-01, A-03, S-23), four ER−/HER2− tumor samples (59826, 60046, 62706, 62944), 2 ER−/HER2+ tumor samples (46258, 58955), and three ER+/HER2− tumor samples (41299, 57731, 45163). All data are relative to MCF10A. (A) Mean and median values of the nuclear (left) and mitochondrial (right) encoded tRNAs. (B) Expression of nuclear and mitochondrial encoded tRNAs shown as TreeView image. All values are relative to MCF10A. Green indicates a decreased level of expression; red indicates an increased level of expression relative to MCF10A. Data are grouped according to amino acid type. (C) Expression of nuclear and mitochondrial encoded tRNAs normalized to median shown as TreeView image. All values are relative to MCF10A and normalized to the median value for each sample. Green indicates a decreased level of expression; red indicates an increased level of expression relative to median. Data are grouped according to corresponding amino acid type. (D) Same as (C), data are grouped from high to low expression.
Figure 4.
Figure 4.
The chemical ligation strategy for detection of single base differences between tRNA isoacceptors. (A) Oligonucleotide reactants complementary to target sequence and mechanism of chemical auto-ligation. For tRNA templates, the ligation junction is between a conserved U and the first position of the anticodon. (B) Overview of the strategy. Chemical ligation proceeds efficiently when the nucleotide at the ligation junction is complementary to the template, but poorly when the nucleotide is mismatched. (C) Ligation yield is proportional to the amount of RNA template. Left: ligation reactions using a defined mixture of X = I and C 30-mer RNA templates, and X = C 3′-phosphorothioate substrate. Right: the percent product from gel analysis is plotted against the fraction of X = I 30-mer RNA template. (D) Relative ligation efficiency with matched and mismatched 3′-phosphorothioate substrates on yeast tRNAPhe(GAA) template. (E) Percent ligation product as a function of total RNA. Left: ligation reaction using varying amounts of human total RNA and substrates for tRNAPro(UGG). Right: the percent product from gel analysis is plotted versus the amount of human total RNA.
Figure 5.
Figure 5.
tRNA microarray for the analysis of all isoacceptors. (A) General strategy for single-nucleotide resolution tRNA microarrays. (B) Fluorescence intensity of a human total RNA sample hybridized to a single-nucleotide resolution tRNA microarray. “Sense” indicates probes complementary to tRNA chemical ligation products; “Other” indicates probes complementary to tRNA sequences, as well as probes with a tRNA sequence but not complementary to chemical ligation products (no signal expected). (C) Overview of target tRNA isoacceptor abundance in three breast epithelial cell lines (MCF10A, 184 A1, 184 B5), and six breast cancer cell lines (MDA-MB-231, MCF7, HCC70, ZR-75-1, MDA-MB-436, BT-474). (D) Expression of target tRNA isoacceptors shown as TreeView image. All values are relative to MCF10A. Green indicates decreased level of expression relative to MCF10A; red indicates increased level of expression relative to MCF10A. Data are grouped according to amino acid type.
Figure 6.
Figure 6.
Analysis of codon usage versus tRNA over-expression. (A) Three gene groups are relevant in this analysis (mRNA expression level is derived from signals on Affymetrix mRNA arrays). tRNA expression or over-expression when comparing cancer and non-cancer cells are unlikely to positively correlate to the codon usage of all three groups. (B) Codon usage comparison between cell-line specific genes, cancer-related genes and house-keeping genes. The degree of association was assessed using Spearman's; rho (rs). Mean rs values are plotted for the following pairs: cell line versus cell line, cell line versus house-keeping, cancer-related versus cancer-related, and cancer-related versus house-keeping. Error bars indicate standard deviation from the mean. (C) Association of relative tRNA levels to ratios of codon usage between cancer-related and house-keeping genes. As discussed in the text, a positive association is only expected for the codons that are over-represented in the cancer-related genes (x > 2). (D) Association of relative tRNA levels to ratios of codon usage between the top-third (nine genes) and bottom-third (nine genes) transcribed cell cycle genes. Again, a positive association is only expected for the codons that are over-represented in the top third genes (x > 1.2). (E) Association of relative arginine tRNA isoacceptor levels to the arginine codon frequency of cancer-related genes.

References

    1. Bjornsti MA, Houghton PJ. Lost in translation: dysregulation of cap-dependent translation and cancer. Cancer Cell. 2004;5:519–523. - PubMed
    1. Pandolfi PP. Aberrant mRNA translation in cancer pathogenesis: an old concept revisited comes finally of age. Oncogene. 2004;23:3134–3137. - PubMed
    1. Ruggero D, Pandolfi PP. Does the ribosome translate cancer? Nat Rev Cancer. 2003;3:179–192. - PubMed
    1. White RJ. RNA polymerase III transcription and cancer. Oncogene. 2004;23:3208–3216. - PubMed
    1. Winter AG, Sourvinos G, Allison SJ, Tosh K, Scott PH, Spandidos DA, White RJ. RNA polymerase III transcription factor TFIIIC2 is overexpressed in ovarian tumors. Proc. Natl Acad. Sci. USA. 2000;97:12619–12624. - PMC - PubMed

Publication types