. 2009 Dec 15;18(24):4756-69.
doi: 10.1093/hmg/ddp438. Epub 2009 Sep 26.

A new mouse model for the trisomy of the Abcg1-U2af1 region reveals the complexity of the combinatorial genetic code of down syndrome

Affiliations

A new mouse model for the trisomy of the Abcg1-U2af1 region reveals the complexity of the combinatorial genetic code of down syndrome

Patricia Lopes Pereira et al. Hum Mol Genet. .

Abstract

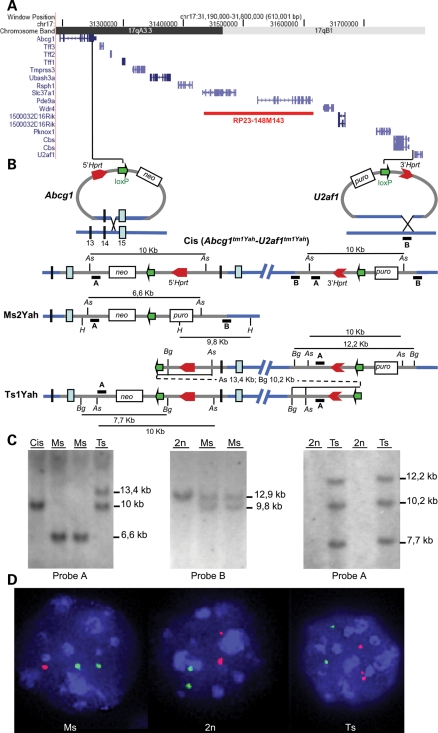
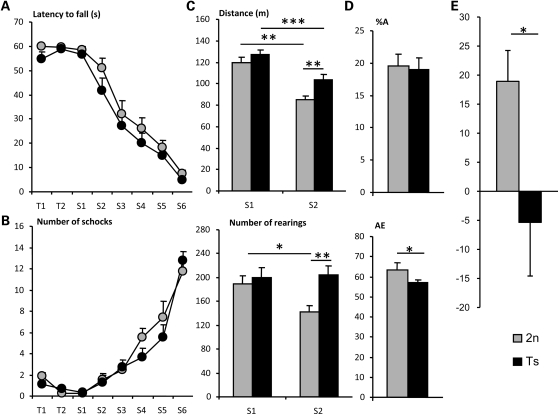
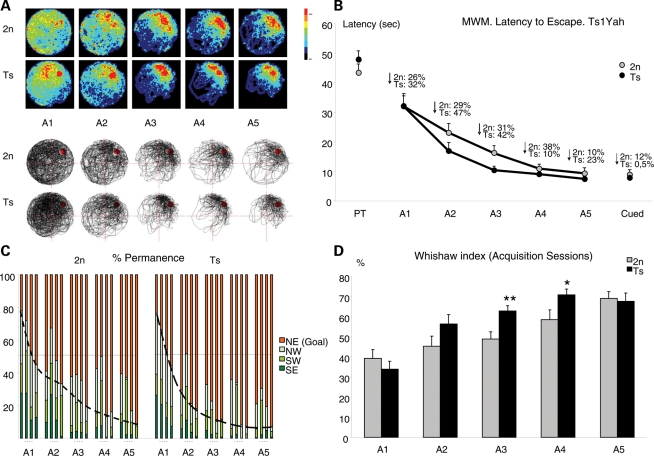
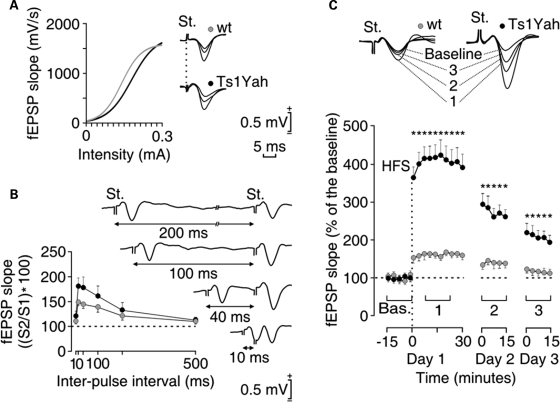
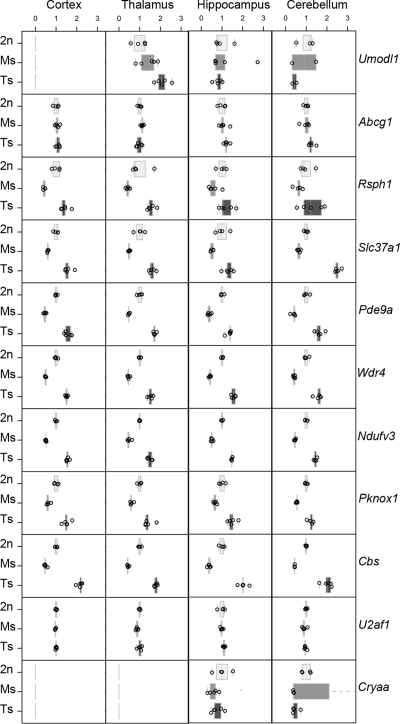
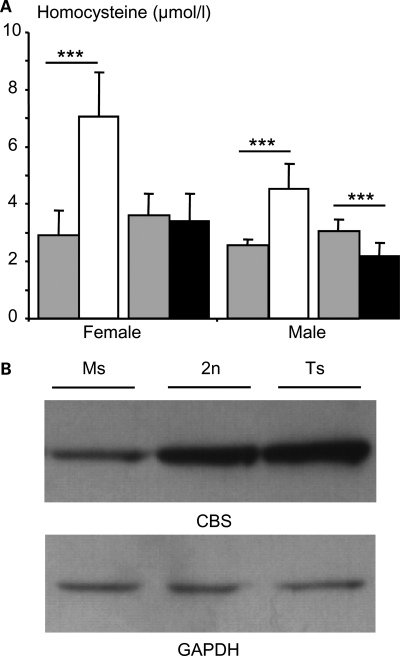
Mental retardation in Down syndrome (DS), the most frequent trisomy in humans, varies from moderate to severe. Several studies both in human and based on mouse models identified some regions of human chromosome 21 (Hsa21) as linked to cognitive deficits. However, other intervals such as the telomeric region of Hsa21 may contribute to the DS phenotype but their role has not yet been investigated in detail. Here we show that the trisomy of the 12 genes, found in the 0.59 Mb (Abcg1-U2af1) Hsa21 sub-telomeric region, in mice (Ts1Yah) produced defects in novel object recognition, open-field and Y-maze tests, similar to other DS models, but induces an improvement of the hippocampal-dependent spatial memory in the Morris water maze along with enhanced and longer lasting long-term potentiation in vivo in the hippocampus. Overall, we demonstrate the contribution of the Abcg1-U2af1 genetic region to cognitive defect in working and short-term recognition memory in DS models. Increase in copy number of the Abcg1-U2af1 interval leads to an unexpected gain of cognitive function in spatial learning. Expression analysis pinpoints several genes, such as Ndufv3, Wdr4, Pknox1 and Cbs, as candidates whose overexpression in the hippocampus might facilitate learning and memory in Ts1Yah mice. Our work unravels the complexity of combinatorial genetic code modulating different aspect of mental retardation in DS patients. It establishes definitely the contribution of the Abcg1-U2af1 orthologous region to the DS etiology and suggests new modulatory pathways for learning and memory.


Figures

Figure 1.
Figure 1.
Generating a 0.59 Mb deletion and duplication between the Abcg1 and U2af1 loci. (A) The 0.59 Mb targeted region, defined by the Abcg1 and U2af1 genes, contains 12 genes as shown from the image captured from the UCSC genome browser (http://genome.ucsc.edu). (B) The targeting vectors containing a loxP site (green arrow), a selectable antibiotic resistance gene (puro, neo), and part of the Hprt gene (3′ or 5′ Hprt, red arrows) were integrated successively in the Abcg1 locus and between the Cbs and U2af1 genes [Cis(Abcg1tm1Yah–U2af1tm1Yah)]. (C) Checking of the new genetic configurations by Southern blot. In embryonic stem cells (left panel), southern analysis with AscI digestion and probe A reveals a 10 kb fragment for the Cis(Abcg1tm1Yah–U2af1tm1Yah) allele, a 6.6 kb for the Ms2Yah allele and two bands at 10 and 13.4 kb for the Ts1Yah locus. In mice (middle), the Ms2Yah allele was checked with probe B, showing an additional HindIII fragment of 9.8 kb compared with the wild-type allele (12.9 kb), whereas the Ts1Yah locus (right panel) was confirmed using the BglII enzyme and probe A. (D) Interphase FISH analysis with BAC probes that map in the Abcg1–U2af1 region (red) and outside (green). The wild-type (2n) showed two red and two green adjacent signals, whereas nuclei from Ms2Yah (Ms) showed two green and only one red signal due to the deletion of the Abcg1–U2af1 region. The Ts1Yah (Ts) nuclei showed two green and three red signal due to the duplication. As: AscI, Bg: BglII, H: HindIII, puro: puromycin, neo: neomycin.
Figure 2.
Figure 2.
Motor activity and behavioral analysis of Ts1Yah mice. Rotarod (A) Mean ± SEM of the latencies to fall from the rotarod and (B) number of shock received on the treadmill by Ts1Yah (black circles) and wild-type males (gray circles) during training sessions (T1 and T2) and along test sessions (S1–S6) with increasing fixed rotational speeds (4, 10, 14, 19, 24, and 34 r.p.m.). Ts1Yah mice do not show significant motor coordination, nor motor learning impairment [Rotarod: F(1,28) = 0.222 P = 0.641; Treadmill: F(1,28) = 0.347 P = 0.561, repeated measures ANOVA]. (C) Mean ± SEM of the traveled distance (in meters (m) upper panel) and number of rears (lower panel) performed by Ts1Yah mice (black bars) and wild-type mice (gray bars) in an open-field during two sessions of 30 min (S1 and S2) with 24 h inter-session interval. During the first session (S1), similar locomotor activity was observed in Ts1Yah mice, but in the second session (S2), a reduced habituation was detected as shown by the 21% increase in travelled distance (***P < 0.001, **P < 0.01, Student's t-test) and 44% increased rearing activity (**P < 0.01, Student's t-test) for the Ts1Yah mice compared with their wild-type peers. (D) Mean ± SEM percentage of alternation (A; upper panel) and number of arm entries (AE; lower panel) of Ts1Yah (black bars) and wild-type mice (gray bars) during a single 5 min session in a Y-maze. Normal motor activity with lower percentage of alternation was found for Ts1Yah mice (*P < 0.05, Student's t-test). In the novel object recognition test (E), working memory is altered in Ts1Yah at 1 h retention. The discrimination index (NF/N+F) reveals a significant deficit in short-term recognition for Ts1Yah mice (black) compared with the wild-type mice (gray) (Kruskal–Wallis one-way analysis *P < 0.05).
Figure 3.
Figure 3.
Analysis of hippocampal-dependent explicit spatial learning and memory. (A) Learning strategies are shown in the graphical representation of swimming paths of wild-type versus Ts1Yah mice along MWM acquisition sessions (A1–A5). Upper panel: Color-coded histograms representing occupancy of wild-type (upper panel) and trisomic (Ts) (lower panel) mice during acquisition sessions of the MWM task. Color scale is given on the right of the histograms. The Ts1Yah mice focused their search in the trained location earlier and more efficiently than wild-type. Lower panel: representative swim paths of a wild-type and a Ts mouse illustrating that controls swam more irregularly than the Ts. (B) Ts1Yah mice learned the platform position more quickly than wild-types, as shown by the steeper acquisition curve (latency to find the platform) although significant differences in escape latency were observed in session 3 [F(1,28) = 7.018 P = 0.014, ANOVA]. As a consequence, Ts1Yah mice showed a significantly higher improvement along sessions (F(1,28) = 5.671 P = 0.025, Repeated Measures ANOVA). (C) Permanence time in quadrants, trial by trial, during acquisition sessions. Ts1Yah mice show a steeper slope than 2n mice, indicating a better performance in learning task. (D) The Whishaw index, defined as percentage path inside an optimal corridor to reach the platform, confirmed better performance of Ts1Yah than control mice [F(1,28) = 8.513 P = 0.007, Repeated Measures ANOVA].
Figure 4.
Figure 4.
Change in long-term potentiation in Ts1Yah mice compared with control littermate. (A) Wild-type (gray circles) and trisomic (black circles) mice presented normal input/output curves. To this end, single (100 ms, biphasic) pulse was presented to Schaffer collaterals at increasing intensities (in mA), while recording the evoked fEPSP at the CA1. Some fEPSPs collected from the four types of mouse are illustrated at the right. (B) There were no significant differences in paired-pulse facilitation between wild-type (gray) and transgenic (black) mice. The data shown are mean ± SEM slopes of the second fEPSP expressed as a percentage of the first for six (10, 20, 40, 100, 200, 500) inter-pulse intervals. Some fEPSP paired traces collected from a representative Ts1Yah mouse at different inter-pulse intervals (10–200 ms) are illustrated at the right. (C) At the top are illustrated examples of fEPSPs collected from selected wild-type (gray) and Ts1Yah (black) animals before (baseline) and after (–3) high-frequency stimulation (HFS) of Schaffer collaterals. The bottom graphs illustrate the time course of LTP evoked in the CA1 area (fEPSP mean ± SEM) following HFS for wild-type and transgenic mice. The HFS was presented after 15 min of baseline recordings, at the time marked by the dashed line. The fEPSP is given as a percentage of the baseline (100%) slope. Although the two groups presented a significant increase (ANOVA, two-tailed) in fEPSP slope following HFS when compared with baseline records, values collected from the Ts1Yah group were significantly (*P < 0.001; F(24,216) = 25.278) larger than those collected from wt mice at the indicated times.
Figure 5.
Figure 5.
Expression of genes from the Abcg1–U2af1 region in four different Ts1Yah, euploid (Eu) and Ms2Yah mice brain tissues. Box plots of normalized expression levels of 11 Mmu17 genes expressed in the four tissues analyzed (Cortex, Thalamus-Hypothalamus, Hippocampus and Cerebellum). The X-axis is normalized expression values relative to the mean of Eu mice, the Y-axis is the three genotype groups (2n = Eu, Ms = Ms2Yah and Ts = Ts1Yah mice). Each panel represents a gene (shown on right).
Figure 6.
Figure 6.
Detection of plasma homocysteine and CBS protein levels in Ms2Yah and Ts1Yah mice. (A) Mean ± SEM plasma levels of total homocysteine (µmol/l) in females and males Ms2Yah (white box) (n = 15 females and 7 males), Ts1Yah (black box; n = 15 females and 14 males) and their wild-type littermate (gray box; Ms2Yah wild-type littermate: n = 7 females and 9 males and for the Ts1Yah wild-type littermate: n = 15 females and 15 males) at 3 months of age. (B) Western blots of CBS in the liver of Ms2Yah (Ms), control (2n) and Ts1Yah (Ts) adult mice (3 months of age). Equal amounts (20 µg) of protein extracts were loaded in each lane and the same blot was incubated with an antibody against GADPH to normalize loading (***P < 0.001, Student's t-test).

References

    1. Antonarakis S.E., Lyle R., Dermitzakis E.T., Reymond A., Deutsch S. Chromosome 21 and down syndrome: from genomics to pathophysiology. Nat. Rev. Genet. 2004;5:725–738. - PubMed
    1. Nadel L. Down's syndrome: a genetic disorder in biobehavioral perspective. Genes Brain Behav. 2003;2:156–166. - PubMed
    1. Antonarakis S.E., Epstein C.J. The challenge of Down syndrome. Trends Mol. Med. 2006;12:473–479. - PubMed
    1. Gibson D., Groeneweg G., Jerry P., Harris A. Age and pattern of intellectual decline among Down syndrome and other mentally retarded adults. Int. J. Rehabil. Res. 1988;11:47–55. - PubMed
    1. Korenberg J.R., Chen X.N., Schipper R., Sun Z., Gonsky R., Gerwehr S., Carpenter N., Daumer C., Dignan P., Disteche C., et al. Down syndrome phenotypes: the consequences of chromosomal imbalance. Proc. Natl Acad. Sci. USA. 1994;91:4997–5001. - PMC - PubMed

Publication types

MeSH terms