. 2009 Sep 3;14(9):3392-410.
doi: 10.3390/molecules14093392.

Identification of a benzamide derivative that inhibits stress-induced adrenal corticosteroid synthesis

Affiliations

Identification of a benzamide derivative that inhibits stress-induced adrenal corticosteroid synthesis

Jing Xu et al. Molecules. .

Abstract

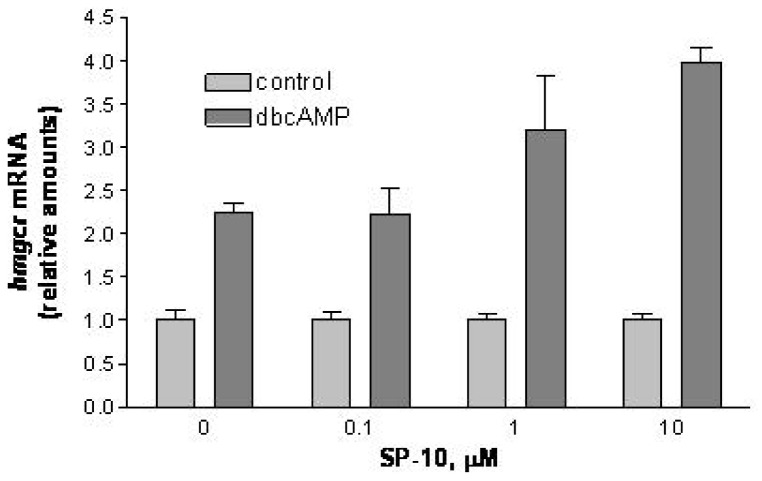
Elevated serum glucocorticoid levels contribute to the progression of many diseases, including depression, Alzheimer's disease, hypertension, and acquired immunodeficiency syndrome. Here we show that the benzamide derivative N-[2-(4-cyclopropanecarbonyl-3-methyl-piperazin-1-yl)-1-(tert-butyl-1H-indol-3-yl-methyl)-2-oxo-ethyl]-4-nitrobenzamide (SP-10) inhibits dibutyryl cyclic AMP (dbcAMP)-induced corticosteroid synthesis in a dose-dependent manner in Y-1 adrenal cortical mouse tumor cells, without affecting basal steroid synthesis and reduced stress-induced corticosterone increases in rats without affecting the physiological levels of the steroid in blood. SP-10 did not affect cholesterol transport and metabolism by the mitochondria but was unexpectedly found to increase 3-hydroxy-3-methylglutaryl-coenzyme A, low density lipoprotein receptor, and scavenger receptor class B type I (SR-BI) expression. However, it also markedly reduced dbcAMP-induced NBD-cholesterol uptake, suggesting that this is a compensatory mechanism aimed at maintaining cholesterol levels. SP-10 also induced a redistribution of filamentous (F-) and monomeric (G-) actin, leading to decreased actin levels in the submembrane cytoskeleton suggesting that SP-10-induced changes in actin distribution might prevent the formation of microvilli-cellular structures required for SRBI-mediated cholesterol uptake in adrenal cells.


Figures

Figure 1
Figure 1
Chemical formula of SP-10, N-[2-(4-cyclopropanecarbonyl-3-methyl-piperazin-1-yl)-1-(tert-butyl-1H-indol-3-yl-methyl)-2-oxo-ethyl]-4-nitrobenzamide.
Figure 2
Figure 2
Effect of SP10 on the dbcAMP-induced 20α-hydroxyprogesterone synthesis and cell viability. Y-1 cells were incubated with the indicated concentrations of the SP-10 for 48 h. Culture medium was then changed and cultures were incubated with 1mM dbcAMP for an additional 48 h. (A) 20α-hydroxyprogesterone levels in the culture medium were determined by radioimmunoassay. (*** p < 0.001, ANOVA followed by Scheffe F test) (B) Alternatively, cell viability was measured using the MTT assay. (C) MA-10 Leydig cells were treated with dbcAMP ± 10 μM SP-10 using the same protocol as for Y-1 cells, and progesterone levels in culture media were determined. Results are presented as mean ± SD and represent three independent experiments performed in triplicate.
Figure 3
Figure 3
Male Long-Evans rats weighing 300-350 g were treated with the indicated concentrations of SP-10 once daily (i.p.) for 10 consecutive days. Blood (400 μL) was collected prior to dosing (Day 0) and 24 hours after the final dose (Day 10). Serum corticosterone levels were measured by radioimunoassay. (A) Dose response effect of SP-10 on Day 0 and Day 10 corticosterone concentrations. (B) Data in (A) are presented as the mean percent change in corticosterone levels from Day 0 to Day 10 to better illustrate the dose-dependent effects of SP-10. (ANOVA followed by Scheffe F test, n = 5 per group).
Figure 4
Figure 4
Effect of SP-10 on the cytochrome P450scc activity and P450scc protein expression in Y-1 cells. (A) Y-1 cells were treated with indicated concentrations of SP-10 for 24 h and then treated with 10 μM 22R-hydroxycholesterol for an additional 24 h. 20α-hydroxyprogesterone levels were measured in the medium by radioimmunoassay. Results are presented as mean ± SD and represent three independent experiments performed in triplicate. The effect of the 22R-hydroxycholesterol on steroid formation was statistically significant (p < 0.02, ANOVA). (B) Y-1 cells were treated with the indicated concentrations of SP-10 for 24 h, followed by treatment with 1mM dbcAMP for 24 h. P450scc protein levels were then determined by immunoblot analysis.
Figure 5
Figure 5
Effect of SP-10 on Tspo and Star mRNA levels. Y-1 cell were treated with the indicated concentrations of SP-10 for 24 h. This was followed by treatment with 1mM dbcAMP for 24 h. Tspo and Sta mRNA levels were quantified by Q-PCR. Results are presented as mean ± SD (n = 9 for each group). Tspo and Star mRNA levels were significantly increased by dbcAMP (p < 0.05, ANOVA).
Figure 6
Figure 6
Effect of SP-10 on hmgcr mRNA levels. Y-1 cells were treated with the indicated concentrations of SP-10 for 24 h. Cultures were then treated with 1mM dbcAMP for an additional 24 h. hmgcr mRNA was quantified by Q-PCR using 18SRNA as an internal standard. Results are presented as mean ± SD and represent three independent experiments performed in triplicate. SP-10 at concentrations of 10 μM significantly enhanced dbcAMP-induced increases in hmgcr mRNA levels. (p < 0.05, ANOVA).
Figure 7
Figure 7
Effect of SP-10 on NBD-cholesterol uptake. Y-1 cells were incubated with the indicated concentrations of SP-10 for 48 h. Culture media were then changed, and cultures were incubated with 1mM dbcAMP and 1μg/ml NBD-cholesterol for 24 h. NBD-cholesterol uptake was measured by a Vector2 multilable counter equipped with 485 nm excitation and 535 nm emission filters. Total fluorescence values were normalized to cellular protein. Results are presented as mean ± SD (n = 12 for each group). (** p < 0.01, *** p < 0.001 versus vehicle-treated group, ┴┴ p < 0.01 versus vehicle-treated control group, ANOVA followed by Scheffe F test).
Figure 8
Figure 8
Effect of SP-10 on LDL-R mRNA levels and SR-BI protein levels. Y-1 cells were treated with the indicated concentration of SP10 for 24 h. They were then treated with 1 mM dbcAMP for 24 h. (A) LDL-R mRNA was quantified by Q-PCR. Results are presented as mean ± SD. (n ≥ 3 for each group). SP-10 at concentrations of 10μM significantly enhanced dbcAMP-induced increases in LDL-R mRNA levels (p < 0.01, ANOVA). B. SR-BI receptor protein levels were determined by immunoblot analysis.
Figure 9
Figure 9
Effect of SP-10 on actin localization. Y-1 cells grown on coverslips were treated with SP-10 for 48 h, then washed with PBS and fixed in 4% paraformaldehyde. The cell membranes were permeabilized with 0.1% Triton X-100, then stained with Alexa Fluor 488 phalloidin for F-actin (Green) and Alexa Fluor 594 Deoxyribonuclease I (red) for G-actin. Nuclear DAPI staining (blue; A), F-actin (B) and G-actin (C) localization in control and SP-10 treated cells are shown in the top panels. Panel D shows merged images of F- and G- actin localization. Arrows indicate changes in F-actin distribution. Cells numbered from 1 to 5 on panel C were used for F-actin and G-actin fluorescence quantification.
Figure 10
Figure 10
Submembrane F-actin and cytosolic G-actin quantification. The quantification was performed using NIG ImageJ software on five representative cells of each group, control and SP-10-treated, as numbered on Figure 9 panel C. Results are presented as means ± SD (n = 5 for each group). (** p < 0.01 versus control group, t-test).

Similar articles

Cited by

  • 4-Bromo-N-phenyl-benzamide.
    Fun HK, Chantrapromma S, Sripet W, Ruanwas P, Boonnak N. Fun HK, et al. Acta Crystallogr Sect E Struct Rep Online. 2012 Apr 1;68(Pt 4):o1269-70. doi: 10.1107/S1600536812013487. Epub 2012 Mar 31. Acta Crystallogr Sect E Struct Rep Online. 2012. PMID: 22606197 Free PMC article.

References

    1. McEwen B.S. Corticosteroids and hippocampal plasticity. Ann. N. Y. Acad. Sci. 1994;746:134–142. doi: 10.1111/j.1749-6632.1994.tb39223.x. - DOI - PubMed
    1. Chrousos G.P., Gold P.W. The concepts of stress and stress system disorders. Overview of physical and behavioral homeostasis. JAMA. 1992;267:1244–1252. doi: 10.1001/jama.1992.03480090092034. - DOI - PubMed
    1. Kiraly S.J., Ancill R.J., Dimitrova G. The relationship of endogenous cortisol to psychiatric disorder: a review. Can. J. Psychiatry. 1997;42:415–420. - PubMed
    1. Tafet G.E., Toister-Achituv M., Shinitzky M. Enhancement of serotonin uptake by cortisol: a possible link between stress and depression. Cogn. Affect. Behav. Neurosci. 2001;1:96–104. doi: 10.3758/CABN.1.1.96. - DOI - PubMed
    1. Maeda K., Tanomoto K., Terada T., Shintani T., Kakigi T. Elevated urinary free cortisol in patients with dementia. Neurobiol. Aging. 1991;12:161–163. doi: 10.1016/0197-4580(91)90055-O. - DOI - PubMed

Publication types

MeSH terms