Review
. 2009 Sep 23;14(9):3754-79.
doi: 10.3390/molecules14093754.

Nasal delivery of high molecular weight drugs

Affiliations
Review

Nasal delivery of high molecular weight drugs

Yildiz Ozsoy et al. Molecules. .

Abstract

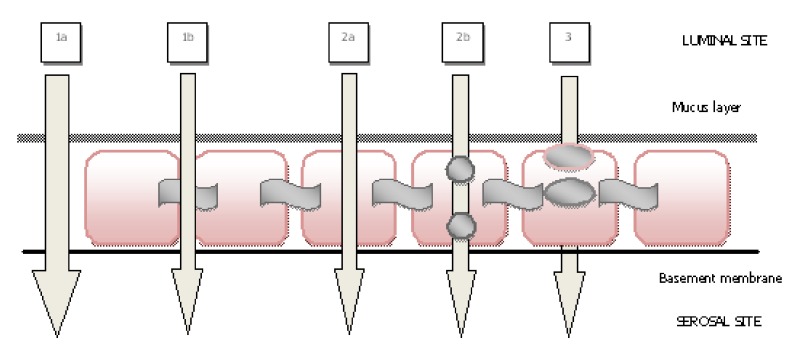
Nasal drug delivery may be used for either local or systemic effects. Low molecular weight drugs with are rapidly absorbed through nasal mucosa. The main reasons for this are the high permeability, fairly wide absorption area, porous and thin endothelial basement membrane of the nasal epithelium. Despite the many advantages of the nasal route, limitations such as the high molecular weight (HMW) of drugs may impede drug absorption through the nasal mucosa. Recent studies have focused particularly on the nasal application of HMW therapeutic agents such as peptide-protein drugs and vaccines intended for systemic effects. Due to their hydrophilic structure, the nasal bioavailability of peptide and protein drugs is normally less than 1%. Besides their weak mucosal membrane permeability and enzymatic degradation in nasal mucosa, these drugs are rapidly cleared from the nasal cavity after administration because of mucociliary clearance. There are many approaches for increasing the residence time of drug formulations in the nasal cavity resulting in enhanced drug absorption. In this review article, nasal route and transport mechanisms across the nasal mucosa will be briefly presented. In the second part, current studies regarding the nasal application of macromolecular drugs and vaccines with nano- and micro-particulate carrier systems will be summarised.


Figures

Figure 1
Figure 1
(1) Paracellular route (1a) intercellular spaces, (1b) tight junctions, (2) transcellular route (2a) passive diffusion, (2b) active transport, (3) transcytosis (modified from Ref. [9]).
Figure 2
Figure 2
Changes of plasma glucose levels after intravenous administration of insulin solution and intranasal administration of insulin-incorporated gelatin (GMS) and aminated gelatin microspheres (AGMS) in dry powder forms. The dose of insulin was 0.5 IU/kg for intravenous route and 5 IU/kg for intranasal route (PBS-phosphate buffer saline). Each point represents mean ± SD (n = 4–5) [reprinted with permission from Ref. [64], copyright Elsevier (2006)].
Figure 3
Figure 3
Comparative hypoglycemic effects of EE–NPs (crosslinked with epichlorohydin/prepared emulsion method nanoparticles) in the presence of Na glycocholate and lysophosphatidylcholine after nasal administration to STZ (streotozotocin) induced diabetic rats (mean ± SE, n = 5) [reprinted with permission from Ref. [52], copyright Elsevier (2008)].
Figure 4
Figure 4
Plasma insulin (a) and blood glucose (b) concentration vs. time profiles following nasal administration of insulin (10 IU/kg) with different CPPs (0.5 mM). Each data point represents the mean ± SEM (n = 3). Key: (▲) insulin; (○) L-R8 (specific L-penetratin); (□) D-R8 (specific D-penetratin); (●) l-penetratin; (■) d-penetratin [reprinted with permission from Ref. [64], copyright Elsevier (2009)].
Figure 5
Figure 5
Comparison of plasma concentration–time profiles following nasal administration of liquid and powder formulations, and subcutaneous administration (○) of 0.3 mg of sCT in dogs. ▲; Formulation-L (sCT in saline), ●; Formulation-PN (powder formulation with NAC and ethylcellulose). Data represent mean plasma concentrations of sCT ± S.D. (n = 4) [reprinted with permission from Ref. [74], copyright Elsevier (2006)].
Figure 6
Figure 6
Changes in anti-factor Xa activity after nasal administration of enoxaparin formulated in saline or in the presence of different concentrations of (A) PEI-25 kDa, (B) PEI-750 kDa, or (C) PEI-1000 kDa. Data represent mean ± S.E.M., n = 3–5 [reprinted with permission from Ref. [91], copyright Elsevier (2006)].
Figure 6
Figure 6
Changes in anti-factor Xa activity after nasal administration of enoxaparin formulated in saline or in the presence of different concentrations of (A) PEI-25 kDa, (B) PEI-750 kDa, or (C) PEI-1000 kDa. Data represent mean ± S.E.M., n = 3–5 [reprinted with permission from Ref. [91], copyright Elsevier (2006)].
Figure 7
Figure 7
IgG antibody levels after i.n. administration of two doses of antigen (10 and 30 μg), encapsulated in chitosan nanoparticles (70 kDa) or in solution in mice (geometric mean ± SEM) [reprinted with permission from Ref. [109], copyright Elsevier (2004)].

Similar articles

Cited by

References

    1. Ugwoke M.I., Verbeke N., Kinget R. The biopharmaceutical aspects of nasal mucoadhesive drug delivery. J. Pharm. Pharmacol. 2001;53:3–21. doi: 10.1211/0022357011775145. - DOI - PubMed
    1. Behl C.R., Pimplaskar H.K., Sileno A.P., deMeireles J., Romeo V.D. Effects of physicochemical properties and other factors on systemic nasal drug delivery. Adv. Drug Deliv. Rev. 1998;29:89–116. doi: 10.1016/S0169-409X(97)00063-X. - DOI - PubMed
    1. Arora P., Sharma S., Garg S. Permeability issues in nasal drug delivery. Drug Discov. Today. 2002;7:967–975. doi: 10.1016/S1359-6446(02)02452-2. - DOI - PubMed
    1. Cornaz A.L., Buri P. Nasal Mucosa as an Absorption Barrier. Eur. J. Pharm. Biopharm. 1994;40:261–270.
    1. Jones N. The Nose and paranasal sinuses physiology and anatomy. Adv. Drug Deliv. Rev. 2001;51:5–19. doi: 10.1016/S0169-409X(01)00172-7. - DOI - PubMed

Substances