. 2009 Oct;16(10):1080-5.
doi: 10.1038/nsmb.1679. Epub 2009 Sep 27.

Interactions between lipids and voltage sensor paddles detected with tarantula toxins

Affiliations

Interactions between lipids and voltage sensor paddles detected with tarantula toxins

Mirela Milescu et al. Nat Struct Mol Biol. 2009 Oct.

Abstract

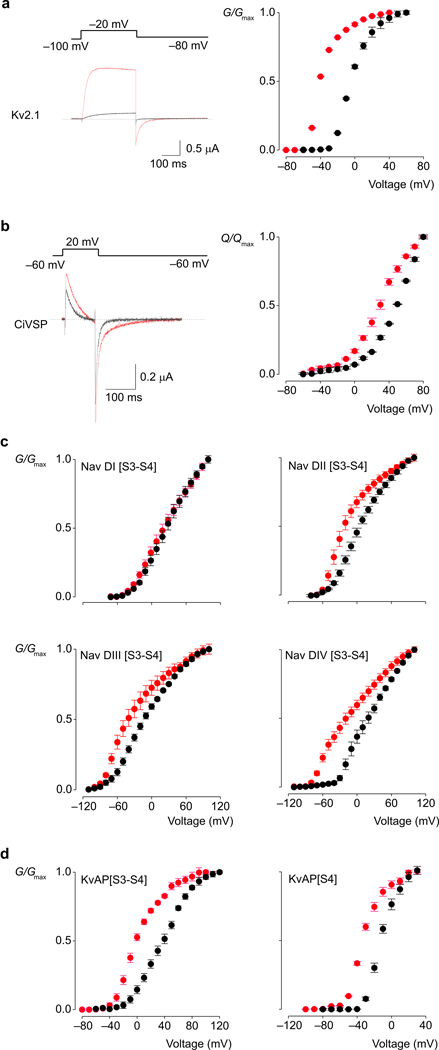
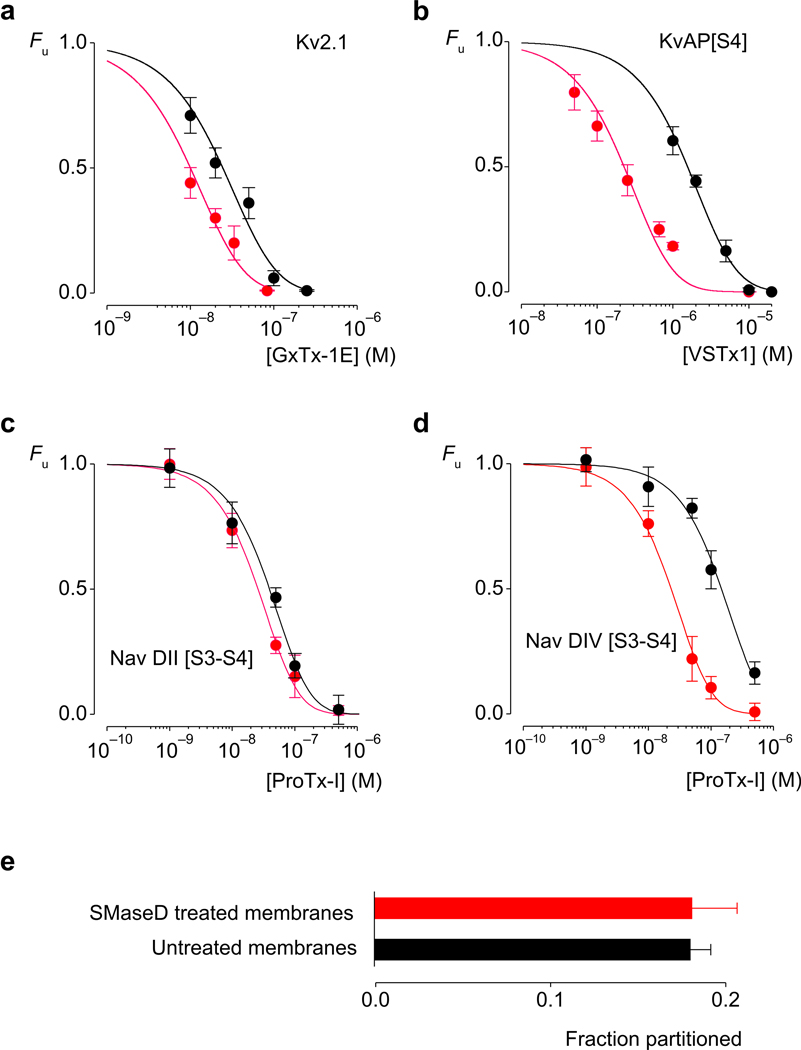
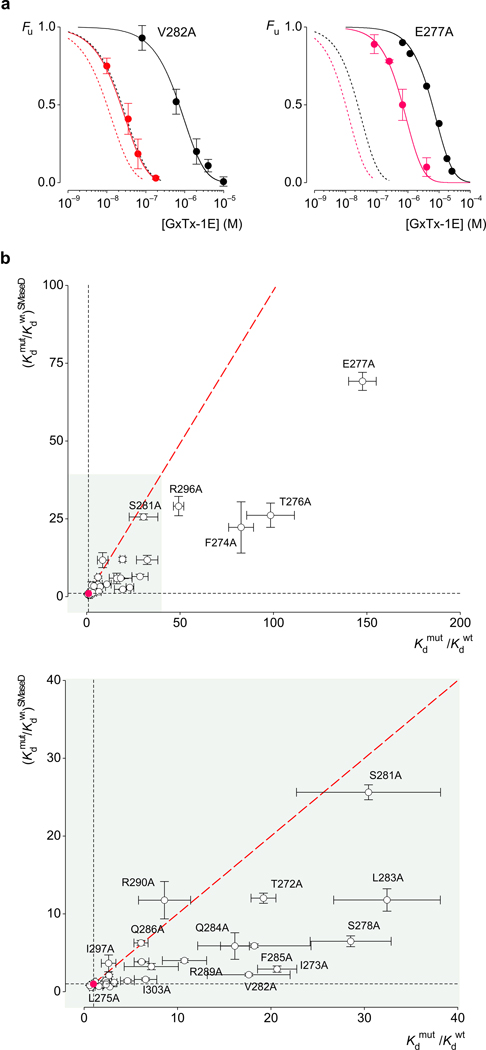
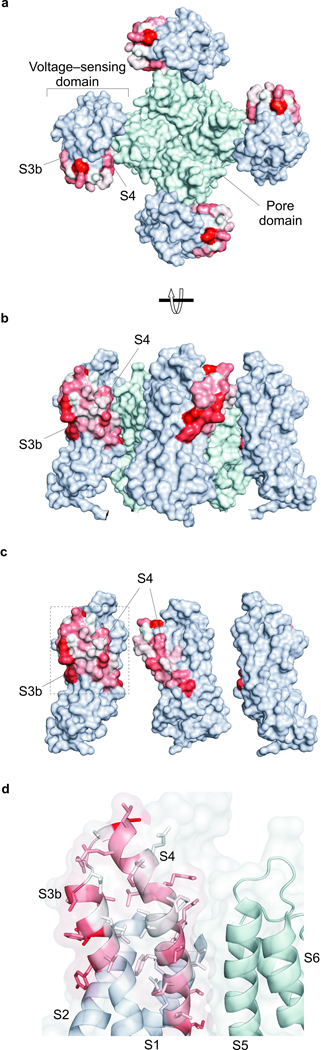
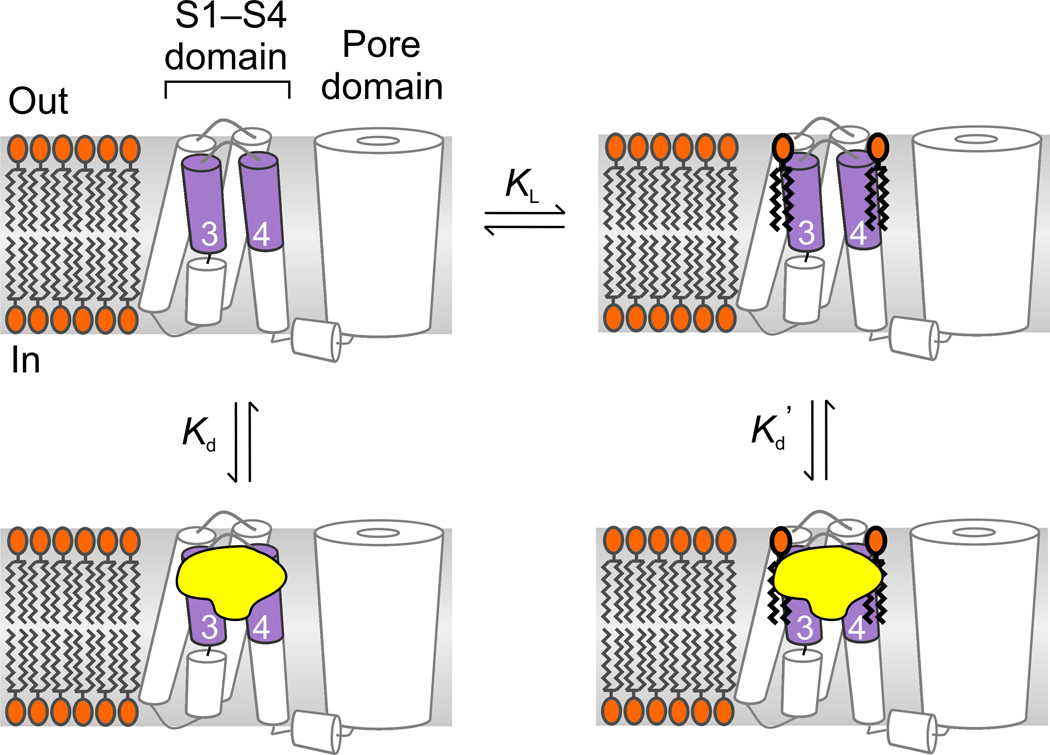
Voltage-activated ion channels open and close in response to changes in voltage, a property that is essential for generating nerve impulses. Studies on voltage-activated potassium (Kv) channels show that voltage-sensor activation is sensitive to the composition of lipids in the surrounding membrane. Here we explore the interaction of lipids with S1-S4 voltage-sensing domains and find that the conversion of the membrane lipid sphingomyelin to ceramide-1-phosphate alters voltage-sensor activation in an S1-S4 voltage-sensing protein lacking an associated pore domain, and that the S3b-S4 paddle motif determines the effects of lipid modification on Kv channels. Using tarantula toxins that bind to paddle motifs within the membrane, we identify mutations in the paddle motif that weaken toxin binding by disrupting lipid-paddle interactions. Our results suggest that lipids bind to voltage-sensing domains and demonstrate that the pharmacological sensitivities of voltage-activated ion channels are influenced by the surrounding lipid membrane.


Figures

Figure 1
Figure 1
Membrane modification alters gating of voltage-activated ion channels and a voltage-activated phosphatase. G-V and Q-V relations obtained for native membranes are shown in black, while those after treatment with SMaseD are shown in red. (a) Ionic current traces and G-V relations for Kv2.1. (b) Gating current traces and Q-V relations for Ci-VSP. (c) G-V curves for Kv2.1 chimeras that contain individual paddle motifs from each of the four domains of rNav1.4. The holding voltage was −100mV for Nav DI and Nav DII, and −120mV for Nav DIII and NavDIV chimeras; test pulse duration was 300ms (500ms for Nav DIV); tail voltage was −60mV for Nav DI, −80mV for Nav DII, −110mV for Nav DIII and −100mV for Nav DIV. (d) G-V curves for chimeras where complete (S3–S4) or partial (S4) paddle motifs of Kv2.1 were replaced with homologous regions from KvAP. The holding voltage was −100mV, test pulse duration was 300ms, and tail voltage was −80mV. In all cases conductance was determined from normalized tail currents. For ionic currents, leak, background and capacitive currents were isolated and subtracted after blocking the Kv channels with agitoxin-2, while for gating currents, they were subtracted using a P/−4 protocol. n=3, error bars are s.e.m.
Figure 2
Figure 2
Membrane modification alters the apparent affinity of tarantula toxins for Kv channels without altering membrane partitioning. Concentration-dependence for tarantula toxin occupancy of wild type and chimaeric Kv channels, before (black) and after (red) SMaseD treatment. Fu represents the fraction of unbound channels and was estimated from fractional inhibition at negative voltages (see Methods; Supplementary Fig 5). Smooth curves represent fits of Fu = ([Toxin]/([Toxin] + Kd)) to the data. The apparent Kd values for the toxin-channel pairs before and after SMaseD treatment are (a) 203±38 nM and 52±8 nM for GxTx-1E and Kv2.1. (b) 10±2.5 µM and 1.6±0.3 µM for VSTx1 and KvAP[S4]. c) 210±9 nM and 137±9 nM for ProTx-I and Nav DII [S3–S4]. (d) 780±77 nM and 122±7 nM for ProTx-I and Nav DII [S3–S4]. n = 3–5 for each toxin concentration and error bars represent s.e.m. At a concentration of 100 nM, ProTx-I had no effect on Nav DI [S3–S4] and Nav DIII [S3–S4] chimeras. (e) Partitioning of 125I-GxTx-1E into oocyte membranes before (black) and after (red) treatment with SMaseD. n=5 and error bars represent s.e.m.
Figure 3
Figure 3
Comparison of the effects of Kv2.1 paddle mutations on GxTx-1E affinity before and after membrane modification with SMaseD. (a) Concentration-dependence for GxTx-1E occupancy of V282A and E277A mutants of Kv2.1 before (black) and after (red) SMaseD treatment. The apparent Kd values are 3.8±0.4 µM and 120±9 nM for V282A, and 30±1.5 µM and 3.5±0.15 µM for E277A. The dotted lines represent the fits for the wild type channel data from Figure 2a. (b,c) Effects of mutations on toxin affinity (Kdmut/Kdwt) for control membranes plotted against that following treatment with SMaseD. The value for the wild type channel is indicated by the red circle. The red dotted line corresponds to identical perturbations for control and SMaseD-treated membranes (no coupling between the mutation and the lipid modification). Data from Supplementary Table 1. Each mutant was examined initially using a concentration of toxin near the Kd for the wild type; mutants with different Kd were further examined using a wider range of concentrations. n=3, error bars are s.e.m.
Figure 4
Figure 4
Coupling energies mapped onto the X-ray structure of a Kv channel and a model for how lipid modification alters toxin affinity. (a) Surface representation of the Kv2.1/Kv1.2 paddle chimera with coupling energies mapped onto the paddle region, viewed from the extracellular side of the membrane. A color gradient between white and red was used to represent increasing |ΔG| values from 0 to 1.3 kcal mol−1. Residues in the pore domain are colored light cyan and those in the S1–S4 domains outside the paddle motif are colored light blue. (b) Surface representation of the Kv2.1/Kv1.2 paddle chimera viewed from the side. (c) Surface representation of the Kv2.1/Kv1.2 paddle chimera viewed from the side with front S1–S4 voltage-sensing domain and central pore domain removed. (d) Close up view of the S3b–S4 paddle motif with transparent surfaces and side chains colored as in a. Residues in the S1–S2 loop were removed for clarity. PDB accession code is 2R9R and all structures were drawn using PyMol (DeLano Scientific Inc.).
Figure 5
Figure 5
Model illustrating toxin binding to lipid-associated paddle motifs. Lipids are depicted as binding and unbinding from the paddle motif and toxin affinity is higher for paddle motifs with lipids bound (Kd’<Kd). Conversion of sphingomyelin to ceramide-1-phosphate could enhance toxin affinity either because the modified lipid binds more strongly (lower KL) or because the toxin binds tighter to paddles interacting with ceramide-1-phosphate compared to sphingomyelin.

Similar articles

Cited by

References

    1. Long SB, Tao X, Campbell EB, MacKinnon R. Atomic structure of a voltage-dependent K+ channel in a lipid membrane-like environment. Nature. 2007;450:376–382. - PubMed
    1. Doyle DA, et al. The structure of the potassium channel: molecular basis of K+ conduction and selectivity. Science. 1998;280:69–77. - PubMed
    1. Swartz KJ. Sensing voltage across lipid membranes. Nature. 2008;456:891–897. - PMC - PubMed
    1. Jiang Y, et al. X-ray structure of a voltage-dependent K+ channel. Nature. 2003;423:33–41. - PubMed
    1. Schmidt D, Jiang QX, MacKinnon R. Phospholipids and the origin of cationic gating charges in voltage sensors. Nature. 2006;444:775–779. - PubMed

Publication types