. 2009 Nov;10(11):1178-84.
doi: 10.1038/ni.1791. Epub 2009 Sep 27.

Interleukin 10 acts on regulatory T cells to maintain expression of the transcription factor Foxp3 and suppressive function in mice with colitis

Affiliations

Interleukin 10 acts on regulatory T cells to maintain expression of the transcription factor Foxp3 and suppressive function in mice with colitis

Masako Murai et al. Nat Immunol. 2009 Nov.

Abstract

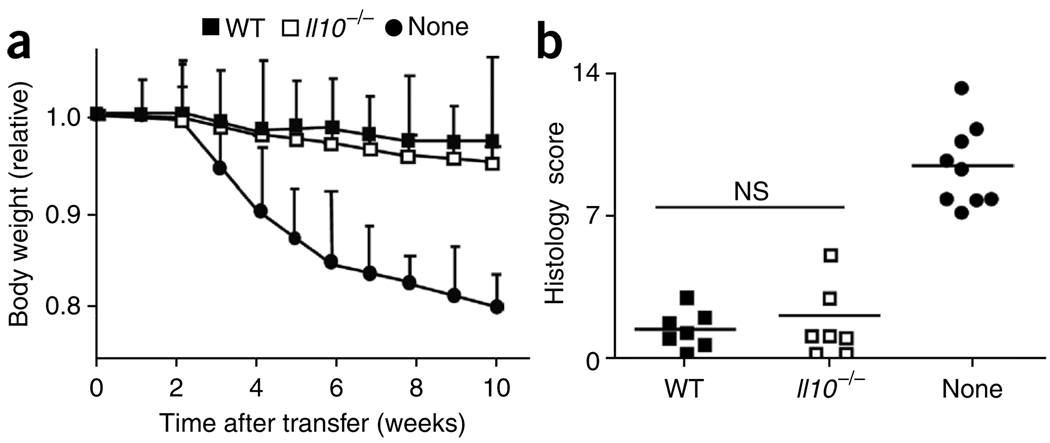
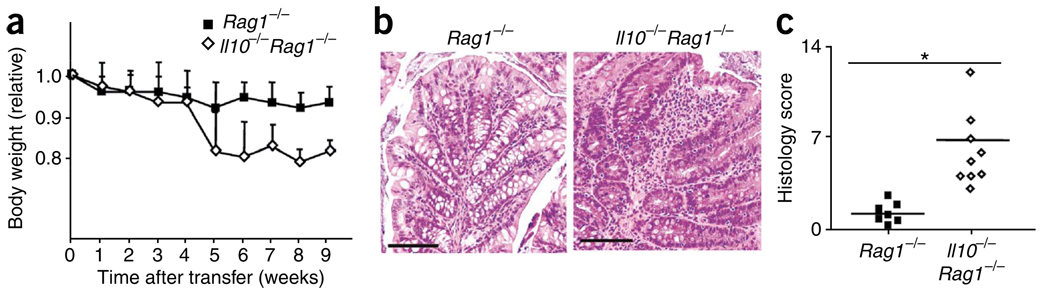
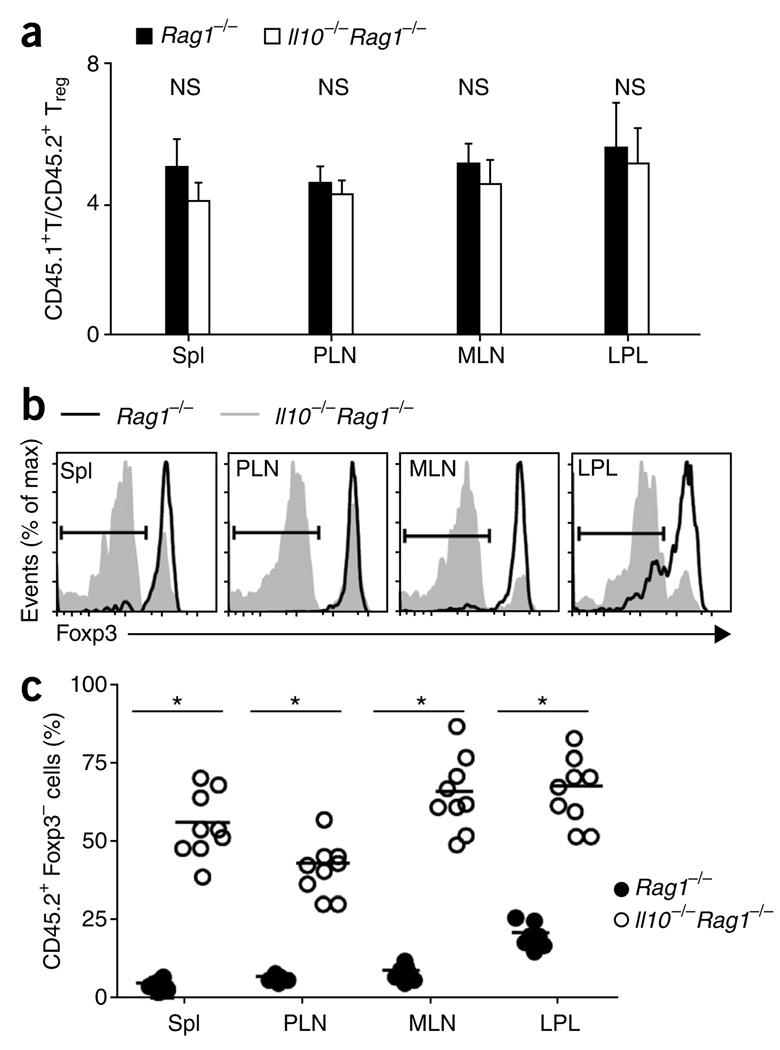
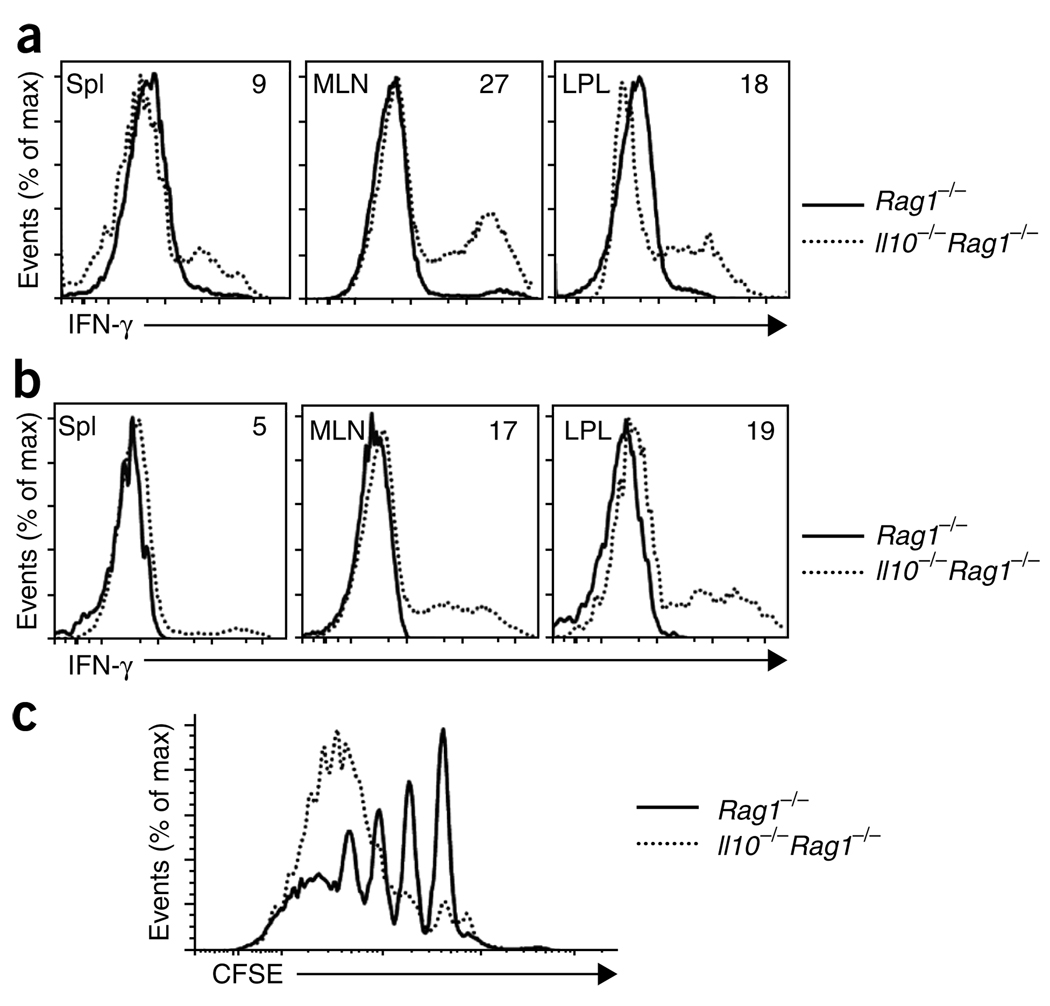
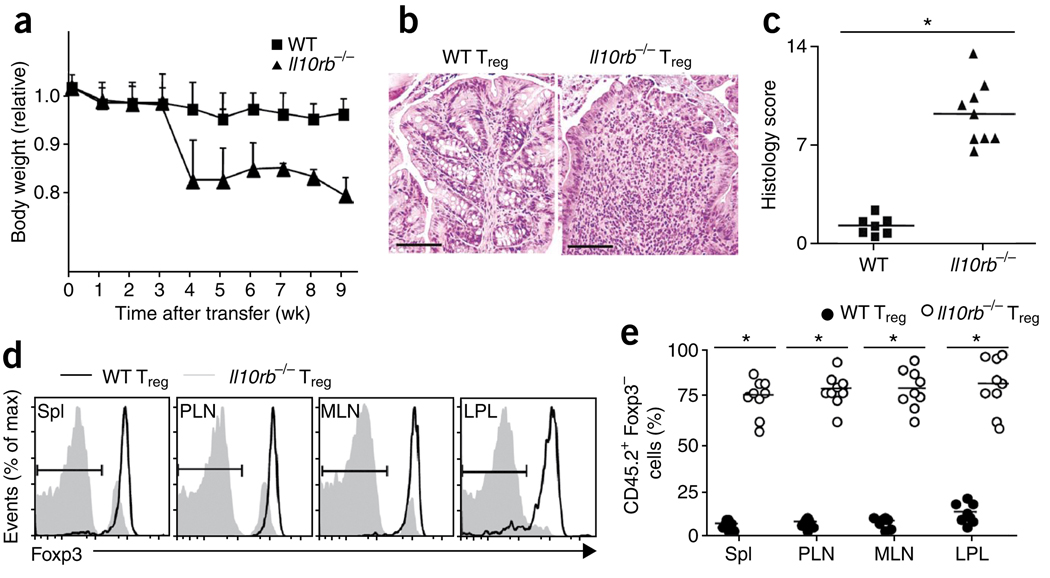
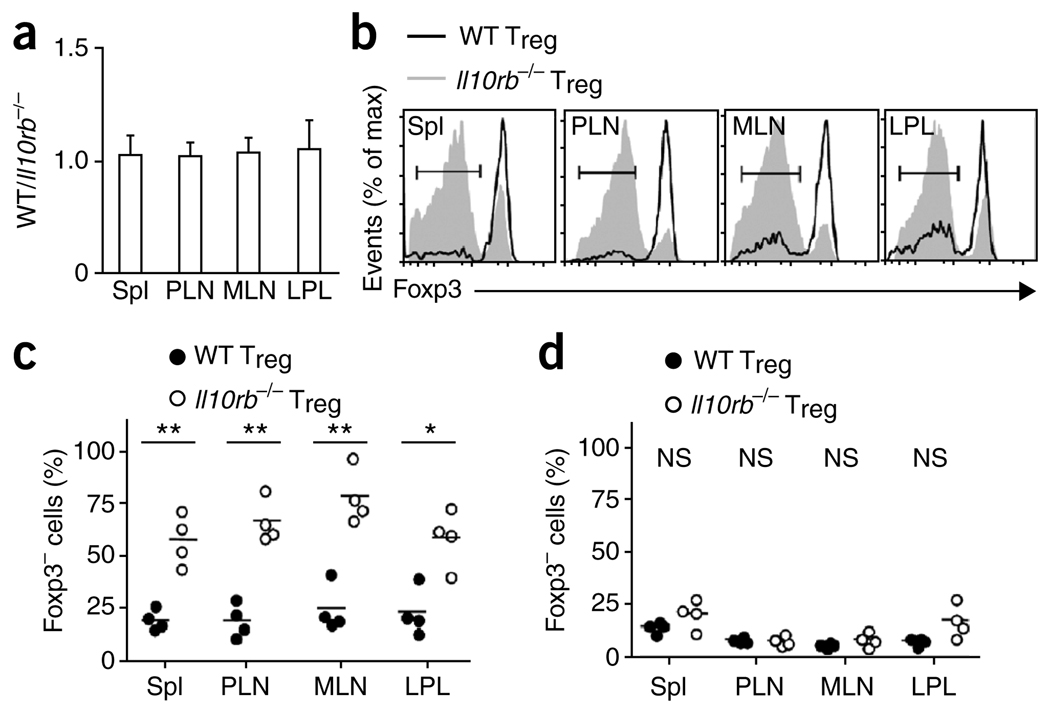
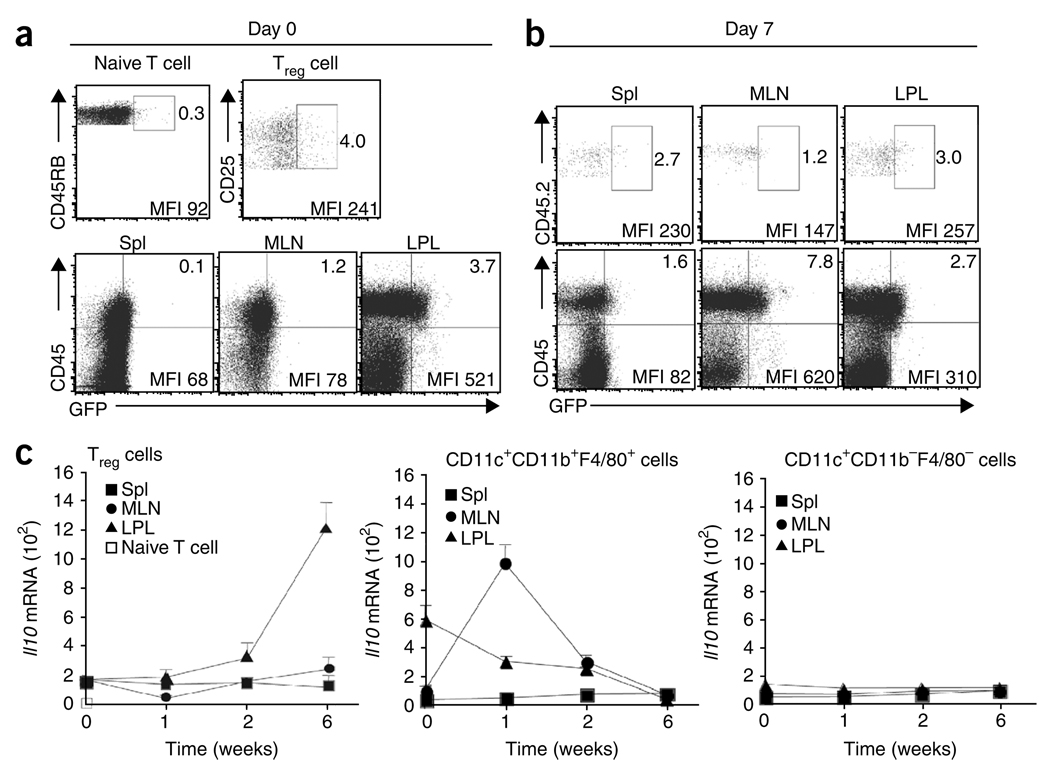
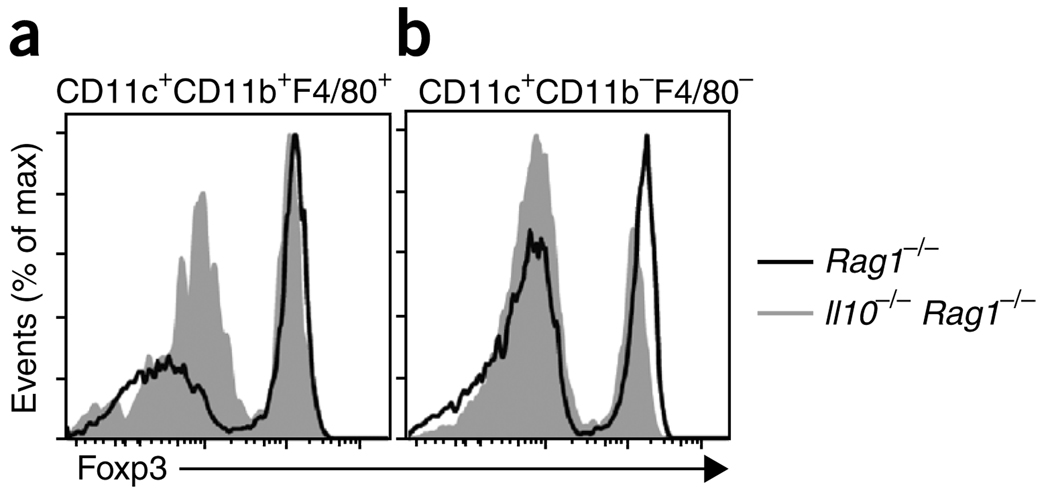
Regulatory T cells (T(reg) cells) that express the transcription factor Foxp3 suppress the activity of other cells. Here we show that interleukin 10 (IL-10) produced by CD11b(+) myeloid cells in recombination-activating gene 1-deficient (Rag1(-/-)) recipient mice was needed to prevent the colitis induced by transferred CD4(+)CD45RB(hi) T cells. In Il10(-/-)Rag1(-/-) mice, T(reg) cells failed to maintain Foxp3 expression and regulatory activity. The loss of Foxp3 expression occurred only in recipients with colitis, which indicates that the requirement for IL-10 is manifested in the presence of inflammation. IL-10 receptor-deficient (Il10rb(-/-)) T(reg) cells also failed to maintain Foxp3 expression, which suggested that host IL-10 acted directly on the T(reg) cells. Our data indicate that IL-10 released from myeloid cells acts in a paracrine manner on T(reg) cells to maintain Foxp3 expression.


Figures

Figure 1
Figure 1
IL-10-deficient Treg cells prevent colitis. (a) Body weight of Rag1−/− mice given sorted Il10−/− or wild-type (WT) CD4+CD25+ Treg cells, together with CD4+CD45RBhi T cells, or of Rag1−/− mice given CD4+CD45RBhi T cells alone (control; None), presented relative to initial body weight. Data are pooled from two independent experiments with six mice each (error bars, s.d.). (b) Histology scores of sections of the large intestine at 6 weeks after the cell transfer described in a. Each symbol represents an individual mouse; small horizontal lines indicate the mean. NS, not significant. Data are pooled from at least two independent experiments.
Figure 2
Figure 2
Rag1−/− host IL-10 is required for Treg cell function. (a) Body weight of Rag1−/− or Il10−/−Rag1−/− hosts given CD4+CD45RBhi T cells plus sorted Foxp3gfp Treg cells, presented relative to initial body weight. Data are pooled from two independent experiments with ten mice each (error bars, s.d.). (b) Proximal colon of Rag1−/− and Il10−/−Rag1−/− mice at 6 weeks after the donor cell transfer described in a; sections are stained with hematoxylin and eosin. Original magnification, ×100; scale bars, 100 µm. Data are representative of one of three independent experiments. (c) Histology scores of sections of the large intestine at 6 weeks after the cell transfer described in a. Each symbol represents an individual mouse; small horizontal lines indicate the mean. *P < 0.001 (two-tailed Student’s t-test). Data are pooled from three independent experiments with a total of nine mice.
Figure 3
Figure 3
Foxp3 is downregulated in Il10−/−Rag1−/− recipients. (a) Composite ratios of CD45.1+ to CD45.2+ TCRβ+CD4+ cells in the spleen (Spl), PLNs, MLNs and LPL of Rag1−/− or Il10−/−Rag1−/− recipient mice at 6 weeks after injection of 4 × 10⁵ CD4+CD45RBhi T cells derived from C57BL/6 (CD45.1+) mice, plus 1 × 10⁵ Foxp3gfp (CD45.2+) Treg cells. (b) Foxp3 expression in the cells in a, gated on TCRβ+CD4+ CD45.2+ cells. Bracketed lines indicate the Foxp3 population. max, maximum. (c) Foxp3 cells in the gated TCRβ+CD4+ CD45.2+ populations in b. Each symbol represents an individual mouse; small horizontal lines indicate the mean. *P < 0.001 (two-tailed Student’s t-test). Data are pooled from three independent experiments with a total of nine mice (a (mean and s.d.) and c) or are representative of one of three independent experiments (b).
Figure 4
Figure 4
Loss of function by Treg cells from Il10−/−Rag1−/− recipients. (a,b) Flow cytometry of intracellular IFN-γ in CD4+CD45RBhi T cells derived from C57BL/6 (CD45.1+) mice transferred with Foxp3gfp (CD45.2+) Treg cells into Rag1−/− or Il10−/−Rag1−/− hosts; plots are gated on the TCRβ+CD4+ CD45.2 progeny of donor CD4+CD45RBhi T cells (a) and the TCRβ+CD4+ CD45.2+ progeny from donor Foxp3gfp + Treg cells (b), isolated from spleen (Spl), MLNs and LPL in mice at 6 weeks after donor cell injection and then stimulated with PMA and ionomycin. Numbers in plots indicate percent IFN-γ-producing cells. (c) Suppressive function in vitro of sorted TCRβ+CD4+ CD45.2+ cells from MLNs of Rag1−/− or Il10−/−Rag1−/− recipients of CD45.1+ CD4+CD45RBhi and CD45.2+ CD4+CD25+CD45RBlo Treg cell populations, cultured for 4 d together with CFSE-labeled CD45.1+ naive T cells; after stimulation of cultures, CFSE dilution was assessed by flow cytometry. Data are representative of one of three (a,b) or two (c) independent experiments.
Figure 5
Figure 5
Il10rb−/− Treg cells fail to prevent colitis. (a) Body weight of Rag1−/− recipients of C57BL/6 (CD45.1+) CD4+CD45RBhi T cells transferred together with wild-type or Il10rb−/− (CD45.2+) Treg cells, presented relative to initial body weight. Data are pooled from two independent experiments with a total of ten mice (error bars, s.d.). (b) Proximal colon of recipient mice at 6 weeks after injection of cells as described in a; sections are stained with hematoxylin and eosin. Original magnification, ×100; scale bars, 100 µm. Data are representative of one of three independent experiments. (c) Histology scores of sections of the large intestine at 6 weeks after the cell transfer described in a. Each symbol represents an individual mouse; small horizontal lines indicate the mean. *P < 0.001 (two-tailed Student’s t-test). Data are pooled from three independent experiments with a total of nine mice. (d) Foxp3 expression by cells isolated from the spleen, PLNs, MLNs and LPL of the recipient mice in a, with gating on TCRβ+CD4+CD45.2+ cells. Bracketed lines indicate the Foxp3 population. Data are representative of one of three independent experiments with a total of nine mice. (e) Foxp3 cells in the TCRβ+CD4+ CD45.2+ T lymphocyte populations described in d. Each symbol represents an individual mouse; small horizontal bars indicate the mean. *P < 0.001 (two-tailed Student’s t-test). Data are pooled from three independent experiments with a total of nine mice.
Figure 6
Figure 6
Foxp3 is lost ‘preferentially’ by Il10rb−/− Treg cells in mice with colitis. (a) Ratio of CD45.1+ to CD45.2+ CD90.1CD4+TCRβ+ cells isolated from spleen, PLNs, MLNs and LPL of Rag1−/− recipients at 6 weeks after injection of 8 × 10⁵ C57BL/6 (CD90.1+) CD4+CD45RBhi T cells, transferred with 2 × 10⁴ wild-type (CD45.1+) Treg cells and 2 × 10⁴ Il10rb−/− (CD45.2+) Treg cells. Data are pooled from two independent experiments with a total of four mice (mean and s.d.). (b) Flow cytometry of Foxp3 expression by cells isolated from a Rag1−/− recipient mouse as described in a, with gating on CD90.1CD4+TCRβ+CD45.2 cells (wild-type Treg cells) or CD90.1CD4+TCRβ+CD45.2+ cells (Il10rb−/− Treg cells). Bracketed lines indicate the Foxp3 population. Data are representative of one of two independent experiments. (c) Foxp3 cells in the CD90.1CD4+TCRβ+CD45.2 (wild-type Treg) and CD90.1CD4+TCRβ+CD45.2+ (Il10rb−/− Treg) populations isolated from Rag1−/− mice as described in a. Each symbol represents an individual mouse; small horizontal bars indicate the mean. Data are pooled from two independent experiments with a total of four mice. (d) Foxp3 cells in CD90.1CD4+TCRβ+CD45.2 (wild-type Treg) or CD90.1CD4+TCRβ+CD45.2+ (Il10rb−/− Treg) populations isolated from Rag1−/− recipients of 4 × 10⁵ C57BL/6 (CD90.1+) CD4+CD45RBhi T cells, transferred together with 1 × 10⁵ wild-type (CD45.1+) and 1 × 10⁵ Il10rb−/− (CD45.2+) Treg cells. Each symbol represents an individual mouse; small horizontal bars indicate the mean. * P < 0.01; ** P < 0.001 (two-tailed Student’s t-test). Data are pooled from two independent experiments with a total of four mice.
Figure 7
Figure 7
Kinetics of IL-10 expression by Treg cells and host cells. (a) GFP+ cells in IL-10 reporter mice. Numbers adjacent to outlined areas (top row) indicate percent GFP+ cells among gated naive splenocytes (TCRβ+CD4+CD45RBhi) and Treg splenocytes (TCRβ+CD4+CD45RBloCD25+) from Il10gfp mice; numbers in top right quadrants (bottom row) indicate percent CD45+GFP+ cells in tissues from Il10gfpRag1−/− mice. MFI, mean fluorescence intensity. (b) Flow cytometry of GFP+ cells in tissues 7 d after transfer of a mixture of CD45.1+ CD4+CD45RBhi T cells and CD45.2+ Il10gfp Treg cells (ratio, 4:1). Top row, Treg cells gated as CD45.2+ TCRβ+CD4+ cells; bottom row, gated TCRβCD4 nonlymphoid cells. Numbers adjacent to outlined areas and in top right quadrants indicate percent GFP+ cells. (c) Real-time PCR analysis of Il10 mRNA in sorted Treg cells (left), CD11b+ cells (middle) and CD11c+ dendritic cells (right) from various sites (keys) before transfer (0) or at 1, 2 and 6 weeks after transfer as in b. Data are from representative one of two independent experiments with six mice (a,b) or are pooled from two independent experiments with six mice (c; mean and s.d.).
Figure 8
Figure 8
IL-10-producing CD11b+ myeloid cells prevent the downregulation of Foxp3. Flow cytometry of Foxp3 expression 3 weeks after the injection of 5 × 10⁶ Rag1−/− or Il10−/−Rag1−/− intestinal CD11c+CD11b+F4/80+ cells (a) or CD11c+CD11bF4/80 cells (b) into Il10−/−Rag1−/− recipients, transferred intravenously on days 0 and 7 (where ‘day 0’ is the day of T cell transfer) with 4 × 10⁵ CD4+ CD45RBhi (CD45.1+) cells in the presence of 1 × 10⁵ (CD45.2+) Treg cells from Foxp3gfp mice. Plots are gated on TCRβ+CD4+CD45.2+ splenocytes. Data are representative of one of two independent experiments with a total of three mice.

Comment in

Similar articles

Cited by

References

    1. Powrie F, Leach MW, Mauze S, Caddle LB, Coffman RL. Phenotypically distinct subsets of CD4+ T cells induce or protect from chronic intestinal inflammation in C. B-17 scid mice. Int. Immunol. 1993;5:1461–1471. - PubMed
    1. Powrie F, et al. Inhibition of Th1 responses prevents inflammatory bowel disease in scid mice reconstituted with CD45RBhi CD4+ T cells. Immunity. 1994;1:553–562. - PubMed
    1. Powrie F, Correa-Oliveira R, Mauze S, Coffman RL. Regulatory interactions between CD45RBhigh and CD45RBlow CD4+ T cells are important for the balance between protective and pathogenic cell-mediated immunity. J. Exp. Med. 1994;179:589–600. - PMC - PubMed
    1. Mottet C, Uhlig HH, Powrie F. Cutting edge: cure of colitis by CD4+CD25+ regulatory T cells. J. Immunol. 2003;170:3939–3943. - PubMed
    1. Annacker O, et al. CD25+CD4+ T cells regulate the expansion of peripheral CD4 T cells through the production of IL-10. J. Immunol. 2001;166:3008–3018. - PubMed

Publication types