. 2009 Nov;10(11):1185-92.
doi: 10.1038/ni.1790. Epub 2009 Sep 27.

Interactions between PD-1 and PD-L1 promote tolerance by blocking the TCR-induced stop signal

Affiliations

Interactions between PD-1 and PD-L1 promote tolerance by blocking the TCR-induced stop signal

Brian T Fife et al. Nat Immunol. 2009 Nov.

Abstract

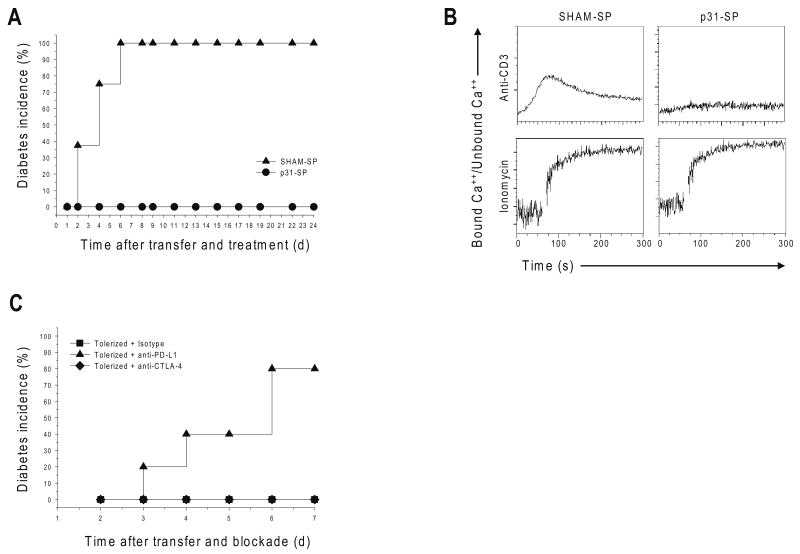
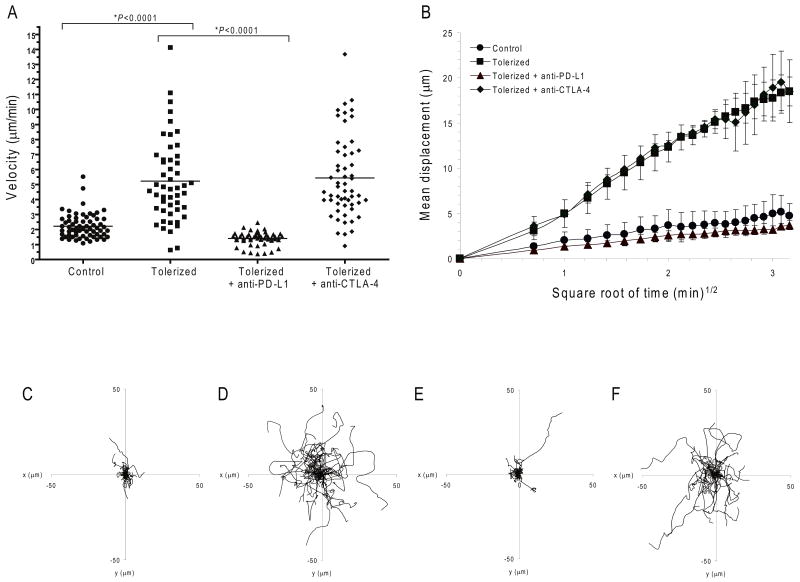
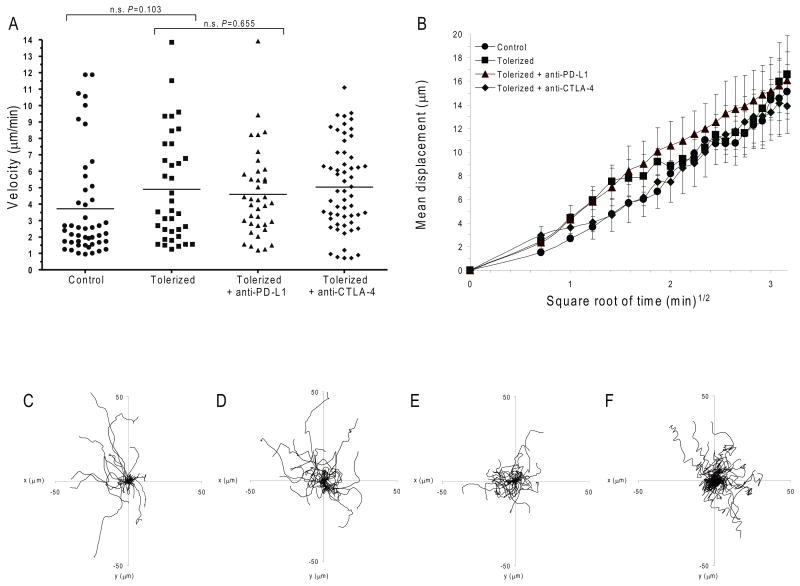
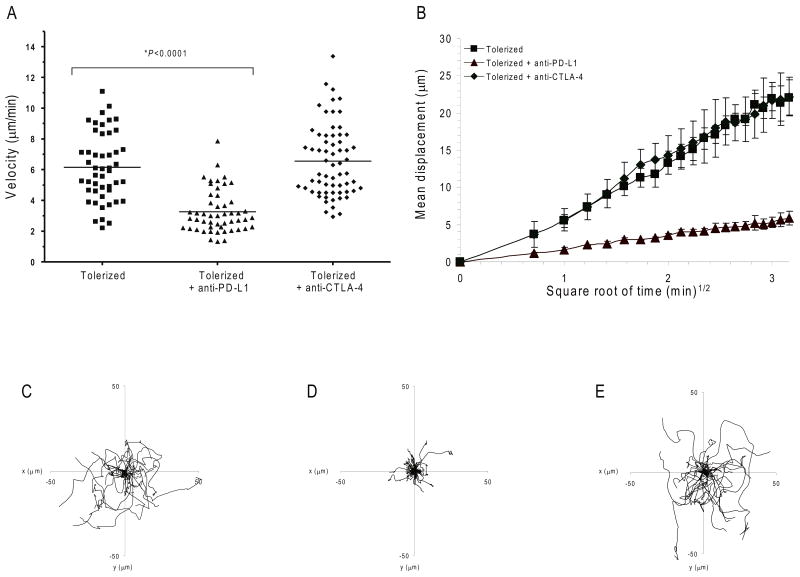
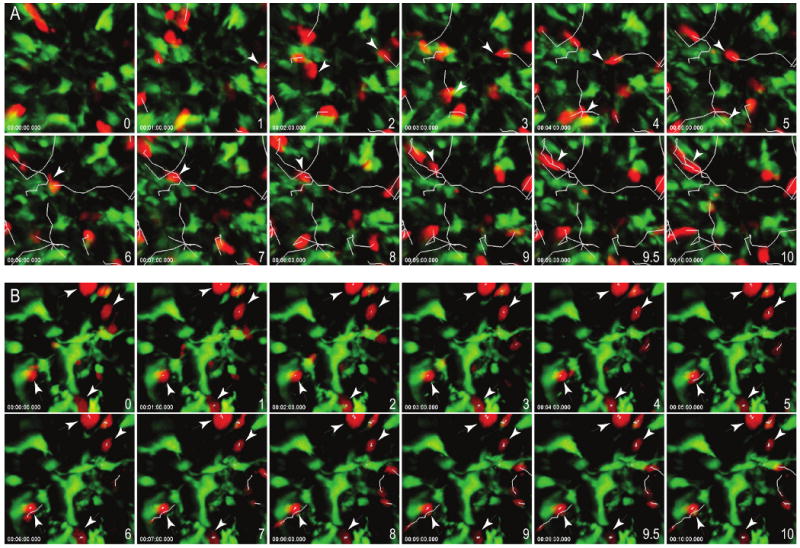
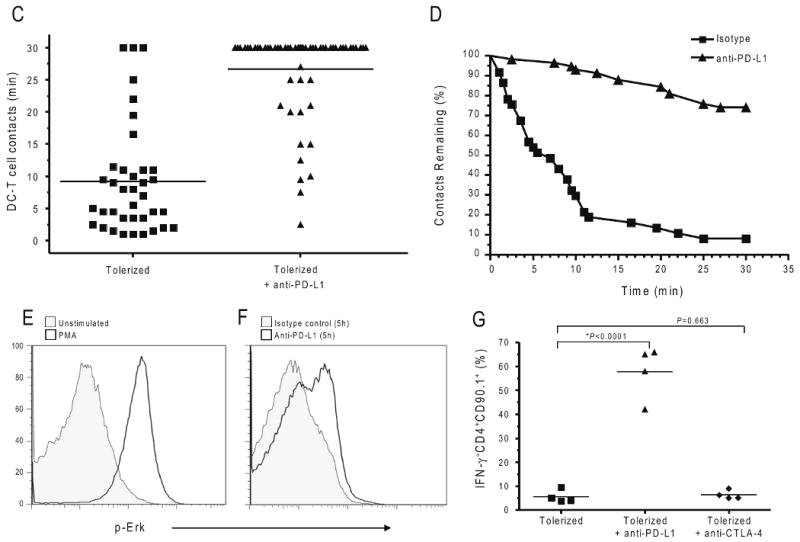
Programmed death 1 (PD-1) is an inhibitory molecule expressed on activated T cells; however, the biological context in which PD-1 controls T cell tolerance remains unclear. Using two-photon laser-scanning microscopy, we show here that unlike naive or activated islet antigen-specific T cells, tolerized islet antigen-specific T cells moved freely and did not swarm around antigen-bearing dendritic cells (DCs) in pancreatic lymph nodes. Inhibition of T cell antigen receptor (TCR)-driven stop signals depended on continued interactions between PD-1 and its ligand, PD-L1, as antibody blockade of PD-1 or PD-L1 resulted in lower T cell motility, enhanced T cell-DC contacts and caused autoimmune diabetes. Blockade of the immunomodulatory receptor CTLA-4 did not alter T cell motility or abrogate tolerance. Thus, PD-1-PD-L1 interactions maintain peripheral tolerance by mechanisms fundamentally distinct from those of CTLA-4.


Figures

Figure 1
Figure 1. Antigen-specific tolerance blocks diabetes, TCR signaling and Ca++ flux in a PD-L1-dependent manner
(a) p31-SP tolerance prevents T1D induced by BDC2.5 T cell adoptive transfer. Activated BDC2.5 T cells were transferred to NOD mice followed with p31-SP (p31 Tolerized) or SHAM-SP (Activated control) treatment the same day. The percentages of diabetic mice receiving SHAM-SP (n=8) compared to p31-SP protected mice are shown (n=8). (b) p31-SP tolerized cells have decreased ability to flux calcium upon TCR ligation. BDC2.5 TCR CD4+ T cells treated in vivo with p31-SP (p31-Tolerized) or SHAM-SP (Control) were purified and loaded with Indo-1. Cells were activated with anti-CD3 (5μg/ml) and cross-linking antibody or ionomycin as indicated, and calcium flux was measured. (c) PD-L1 blockade breaks tolerance. 2×10⁶ p31-SP tolerized BDC2.5 TCR transgenic T cells were transferred to naïve recipients followed by anti-PD-L1, anti-CTLA-4 or isotype control antibody treatments. Recipient mice were monitored for the development of T1D by blood glucose measurements. The percentage of diabetic mice receiving anti-PD-L1 (n=5), isotype control (n=5) and anti-CTLA-4 (n=5) are shown. Data are representative of three or more independent experiments except (c) which was from two independent experiments.
Figure 2
Figure 2. PD-1-PD-L1 but not CTLA-4 prevents the T cell stop signal
Dynamic migration of BDC2.5 diabetogenic CD4+ T cells in PLN. CMTMR-labeled control or tolerized BDC2.5 T cells were injected into NOD.CD11c-YFP recipient mice. (a-f) Multi-photon image analysis of T cells in islet antigen-containing PLN. (a) Mean velocity of adoptively transferred BDC2.5 T cells in mice subsequently injected with anti-PD-L1, anti-CTLA-4 or isotype control antibody. Horizontal lines illustrate the mean velocity for each group. (b) Mean displacement of BDC2.5 T cells plotted against the square root of time. Shown is the mean of multiple imaging data sets from PLN of mice receiving control T cells, tolerized T cells with isotype control antibody, tolerized T cells with anti-PD-L1, and tolerized T cells with anti-CTLA-4. Data show mean ± s.d.. A time-lapse recording corresponding to this region is shown for each group in Supplementary Movies 1-4. (c-f) Superimposed 10 min tracks of 40-60 randomly selected T cells from each treatment group in the xy plane, setting the starting coordinates from the origin 0,0. Units are in micrometers. Each line represents the path of one cell. Data are representative of three or more independent experiments.
Figure 3
Figure 3. PD-L1 inhibition requires antigen
Dynamic migration of BDC2.5 diabetogenic CD4+ T cells in ILN. CMTMR-labeled control or tolerized BDC2.5 T cells were injected into NOD.CD11c-YFP recipient mice. (a-f) Multi-photon image analysis of T cells in non-islet antigen-containing ILN. (a) Mean velocity of adoptively transferred BDC2.5 T cells in mice subsequently injected with anti-PD-L1, andi-CTLA-4 or isotype control antibody. Horizontal lines illustrate the mean velocity for each group. (b) Mean displacement of BDC2.5 T cells plotted against the square root of time. Shown is the mean of multiple imaging data sets from ILN of mice receiving control T cells, tolerized T cells with isotype control antibody, tolerized T cells with anti-PD-L1, and tolerized T cells with anti-CTLA-4. Data show mean ± s.d.. A time-lapse recording corresponding to this region is shown for each group in Supplementary Movies 5-8c-f) Superimposed 10 min tracks of 40-50 randomly selected T cells from each treatment group in the xy plane, setting the starting coordinates from the origin 0,0. Units are in micrometers. Each line represents the path of one cell. Data are representative of three or more independent experiments.
Figure 4
Figure 4. PD-L1 inhibits T cell movement within the islets
Dynamics and motility of BDC2.5 diabetogenic CD4+ T cells in the pancreatic islets. NOD.SCID mice were transplanted with MIP-eGFP (green) islets under the kidney capsule, and were subsequently injected with CMTMR-labeled tolerized BDC2.5 T cells (red) and the indicated antibodies. Transplanted islets were imaged by multi-photon microscopy. (a) Average velocity of tolerized BDC2.5 T cells transferred into mice treated with isotype control antibody, anti-PD-L1, or anti-CTLA-4. Mean velocity is represented by the horizontal lines. A time-lapse recording corresponding to this region is shown for each treatment group in Supplementary Movies 10-12. (b) Mean displacement of BDC2.5 T cells plotted against the square root of time. Shown is the mean of multiple imaging data sets from mouse islets receiving tolerized T cells with anti-PD-L1, anti-CTLA-4 or isotype control antibody. Data show mean ± s.d. (c-e) Superimposed 10 min tracks of 43-60 randomly selected T cells from each treatment group in the xy plane, setting the starting coordinates from the origin 0,0. Units are in micrometers. Each line represents the path of one cell. Data are representative of at least three independent experiments.
Figure 5
Figure 5. PD-L1 blockade promotes prolonged T cell-DC interactions and T cell activation
Time-lapse images of contacts between CD11c+ DC (green) and BDC2.5 T cells (red) from the PLN of (a) isotype control or (b) anti-PD-L1 treated recipients. Scale bars, 15 μm. Corresponding time-lapse recordings are shown in Supplementary Movies 13-16. (c) Contact times between antigen-specific tolerized T cells and antigen-bearing CD11c+ DCs following injection of isotype control antibody or anti-PD-L1. Each symbol represents an individual cell. The mean from each group is shown as a horizontal line. (d) Contact time decay curves illustrate the percentage of total T cell-DC contacts remaining after injection of isotype control or anti-PD-L1 antibody over time (min). (e) Intracellular phosphorylated Erk expression in tolerized BDC2.5 T cells that were isolated and left unstimulated or stimulated with PMA. (f) Intracellular phosphorylated Erk expression in tolerized BDC2.5 T cells directly ex vivo from mice treated with isotype control antibody or anti-PD-L1. (g) PD-L1 blockade restores effector cytokine production within the pancreatic islets. Interferon reporter BDC2.5.Thy1.1.Yeti mice were injected with p31-SP followed by anti-PD-L1, anti-CTLA-4, or isotype control antibody. Three days after antibody treatment, pancreas infiltrating CD4+IFN-γ+ (YFP+) cells were analyzed by flow cytometry. Shown is the percentage of CD4+IFN-γ+ BDC2.5 T cells. Data are representative from at least three independent experiments except (f) which was from two independent experiments.

Comment in

Similar articles

Cited by

References

    1. Walunas TL, et al. CTLA-4 can function as a negative regulator of T cell activation. Immunity. 1994;1:405–13. - PubMed
    1. Luhder F, Chambers C, Allison JP, Benoist C, Mathis D. Pinpointing when T cell costimulatory receptor CTLA-4 must be engaged to dampen diabetogenic T cells. Proc Natl Acad Sci U S A. 2000;97:12204–9. - PMC - PubMed
    1. Chikuma S, Imboden JB, Bluestone JA. Negative regulation of T cell receptor-lipid raft interaction by cytotoxic T lymphocyte-associated antigen 4. J Exp Med. 2003;197:129–35. - PMC - PubMed
    1. Keir ME, Butte MJ, Freeman GJ, Sharpe AH. PD-1 and Its Ligands in Tolerance and Immunity. Annu Rev Immunol. 2008 - PMC - PubMed
    1. Tivol EA, et al. Loss of CTLA-4 leads to massive lymphoproliferation and fatal multiorgan tissue destruction, revealing a critical negative regulatory role of CTLA-4. Immunity. 1995;3:541–7. - PubMed

Publication types

MeSH terms