. 2010 Jan;17(1):1-14.
doi: 10.1007/s12640-009-9067-4.

The role of zinc in the modulation of neuronal proliferation and apoptosis

Affiliations

The role of zinc in the modulation of neuronal proliferation and apoptosis

Ana M Adamo et al. Neurotox Res. 2010 Jan.

Abstract

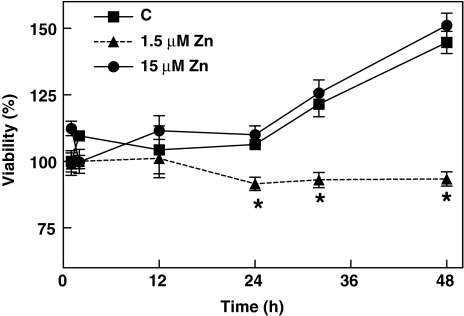
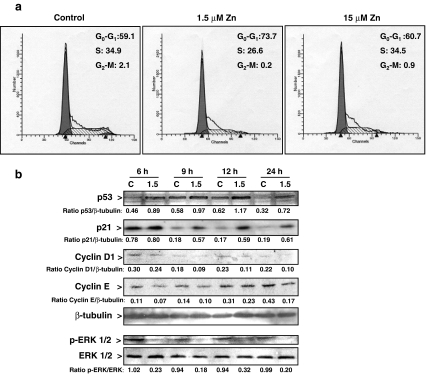
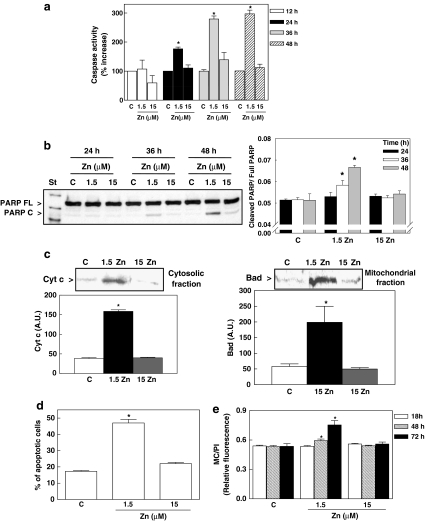
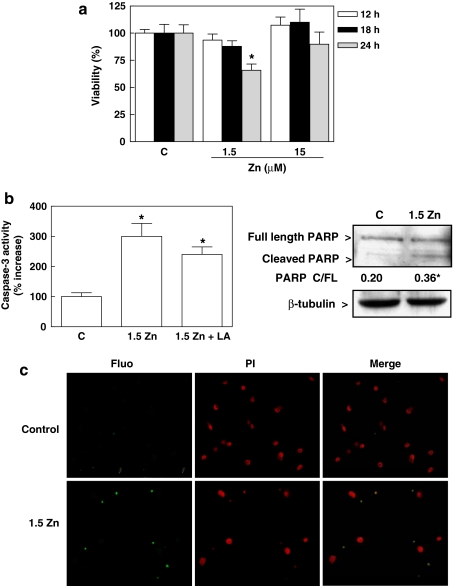
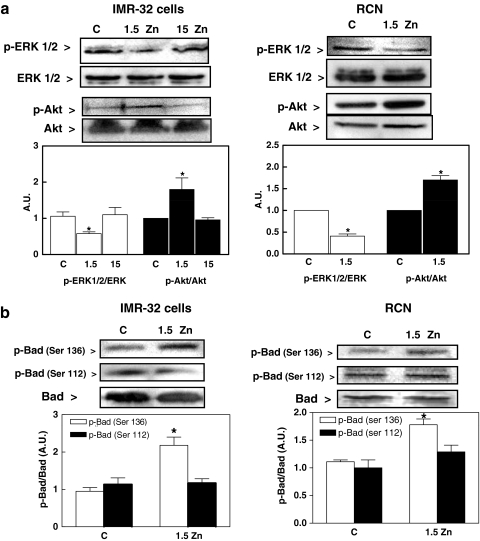
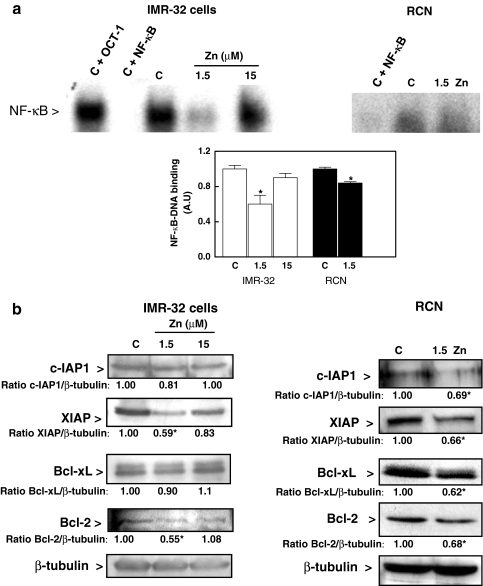
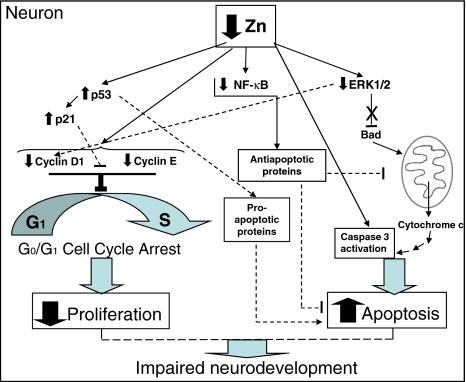
Although a requirement of zinc (Zn) for normal brain development is well documented, the extent to which Zn can modulate neuronal proliferation and apoptosis is not clear. Thus, we investigated the role of Zn in the regulation of these two critical events. A low Zn availability leads to decreased cell viability in human neuroblastoma IMR-32 cells and primary cultures of rat cortical neurons. This occurs in part as a consequence of decreased cell proliferation and increased apoptotic cell death. In IMR-32 cells, Zn deficiency led to the inhibition of cell proliferation through the arrest of the cell cycle at the G0/G1 phase. Zn deficiency induced apoptosis in both proliferating and quiescent neuronal cells via the intrinsic apoptotic pathway. Reductions in cellular Zn triggered a translocation of the pro-apoptotic protein Bad to the mitochondria, cytochrome c release, and caspase-3 activation. Apoptosis is the resultant of the inhibition of the prosurvival extracellular-signal-regulated kinase, the inhibition of nuclear factor-kappa B, and associated decreased expression of antiapoptotic proteins, and to a direct activation of caspase-3. A deficit of Zn during critical developmental periods can have persistent effects on brain function secondary to a deregulation of neuronal proliferation and apoptosis.


Figures

Fig. 1
Fig. 1
The influence of Zn deficiency on IMR-32 cell viability. IMR-32 cells were incubated for 1–48 h in control non-chelated medium (C) or chelated media containing 1.5 or 15 μM Zn, after which cell viability was measured as described in “Materials and methods” section. Results are shown as means ± SEM of four independent experiments. * Significantly different compared to C and 15 μM Zn groups (P < 0.01, one-way ANOVA test)
Fig. 2
Fig. 2
Zn deficiency affects the distribution of events in the IMR-32 cell cycle. a Synchronized IMR-32 cells were incubated for 16 h in control non-chelated medium (C) or chelated media containing 1.5 or 15 μM Zn. The evaluation of cell cycle progression was done as described in “Materials and methods” section. The histograms show DNA staining by propidium iodide. The figure shows representative FACS profiles of the distribution of cells in G0–G1, S, and G2–M phases from four independent experiments. b Western blot for p53, cyclins E and D1, p-ERK, ERK, and tubulin in total cell fractions, and p21 (nuclear fractions), in synchronized cells incubated in control (C) or the media containing 1.5 μM Zn (1.5) for the indicated period of time. The figure shows representative images. Numbers under the figures are means from three independent experiments. Values for the 1.5 Zn group are significantly different (P < 0.05) compared to controls at all the times measured for p53, cyclins D1 and E, and p-ERK, and between 9 and 24 h for p21
Fig. 3
Fig. 3
Zn deficiency induces apoptotic cell death in IMR-32 cells. Cells were incubated in control non-chelated medium (C) or chelated media containing 1.5 (1.5 Zn) or 15 μM (15 Zn) Zn for the different periods of time. a Caspase-3 activity after 12, 24, 36, and 48 h of incubation, in the different experimental conditions. b Western blot for full-length and cleaved-PARP in IMR-32 cells incubated in the corresponding media. One representative image out of three independent experiments is shown. c Western blots for Bad and cytochrome c (cyt c) in cytosolic or mitochondrial fractions after 18 h incubation. Representative images out of two to three independent experiments are shown. d DNA nicks were evaluated with the TUNEL staining after 48 h incubation, and the percentage of apoptotic cells was calculated. Results are shown as means ± SEM of four independent experiments. e After 18, 48, and 72 h incubation in the corresponding media, the amount of phosphatidylserine in the outer layer of the cell membrane was evaluated fluorometrically measuring merocyanine 540 (MC) binding, and is expressed relative to the amount of DNA measured as propidium iodide (PI) fluorescence. All results are shown as means ± SEM of two to four independent experiments. * Significantly different compared to C and 15 μM Zn groups (P < 0.01, one-way ANOVA test)
Fig. 4
Fig. 4
Zn deficiency induces apoptotic cell death in rat cortical neurons. Rat cortical neurons were incubated for 12, 18, or 24 h in control non-chelated medium (C) or chelated media containing 1.5 (1.5 Zn) or 15 μM (15 Zn) Zn. a Cell viability was measured as described in “Materials and methods” section. Results are shown as means ± SEM of four independent experiments. * Significantly different compared to C and 15 μM Zn groups (P < 0.01, one-way ANOVA test). b (Left panel) Caspase-3 activity was measured after 18 h incubation in control non-chelated medium (C) or chelated medium containing 1.5 μM Zn without (1.5 Zn) or with the addition of 0.5 mM α-lipoic acid. (Right panel) Western blot for full-length and cleaved-PARP in total cell extracts isolated from rat cortical neurons incubated for 18 h in the corresponding media. Results are shown as means ± SEM (Fig. 3a, b left panel) or means (Fig. 3b right panel) of two to three independent experiments. * Significantly different compared to C group (P < 0.05, one-way ANOVA test). c Apoptotic cells were also visualized by TUNEL assay and fluorescence microscopy after incubating rat cortical neurons for 24 h in the corresponding media. Fluo fluorescein, PI propidium iodide fluorescence
Fig. 5
Fig. 5
Signaling pathways involved in Zn deficiency-induced apoptotic cell death. IMR-32 cells (left panels) and rat cortical neurons (right panels) were incubated in control non-chelated media (C) or chelated media containing 1.5 (1. 5 Zn) or 15 μM (15 Zn) Zn (for IMR-32 cells) for different periods of time. a Western blots for phosphorylated ERK1/2 (p-ERK1/2), ERK1/2, phosphorylated Akt (p-Akt), and Akt after 9 h incubation. b Western blots for phosphorylated Bad at serine 136 [p-Bad (Ser 136)] or serine 112 [p-Bad (Ser 112)]. After quantitation results are expressed as the ratio phosphorylated/non-phosphorylated protein. All results are shown as means ± SEM of three to four independent experiments. * Significantly different compared to C and 15 μM Zn groups (P < 0.05, one-way ANOVA test)
Fig. 6
Fig. 6
Zn deficiency inhibits the expression of antiapoptotic proteins. IMR-32 cells and rat cortical neurons (RCN) were incubated in control non-chelated media (C) or chelated media containing 1.5 or 15 μM Zn (for IMR-32 cells) or chelated media containing 1.5 μM Zn (1.5 Zn) (for rat cortical neurons) for 36 and 24 h, respectively. a EMSA for NF-κB in nuclear fractions. To determine the specificity of the NF-κB-DNA complex, the control nuclear fraction (C) was incubated in the presence of 100-fold molar excess of unlabeled oligonucleotide containing the consensus sequence for either NF-κB (C + NF-κB) or OCT-1 (C + OCT-1) before the binding assay. After the EMSA assays, bands were quantitated and values referred to controls. Results are shown as means ± SEM of three independent experiments. * Significantly different compared to the C and 15 μM Zn groups (P < 0.05, one-way ANOVA test). b The content of different antiapoptotic proteins was evaluated by Western blot in total cell fractions isolated from IMR-32 cells (left panel) or rat cortical neurons (right panel) as described in “Materials and methods” section. Representative images out of two to three independent experiments are shown. Numbers under the figures are means from two to three independent experiments. * Significantly different (P < 0.05) compared to controls
Fig. 7
Fig. 7
Proposed mechanisms for Zn deficiency-induced decrease in cell proliferation and induction of apoptosis. Solid lines indicate events demonstrated in the current work, doted lines indicate proposed mechanisms leading to neuronal cell cycle arrest, decreased proliferation and induction of apoptosis as a consequence of a decreased Zn availability

References

    1. Banker G, Goslin K (eds) (1998) Culturing nerve cells, 2nd edn. MIT, Cambridge, MA, pp 11–36
    1. Bentley ME, Caulfield LE, Ram M, Santizo MC, Hurtado E, Rivera JA, Ruel MT, Brown KH. Zinc supplementation affects the activity patterns of rural Guatemalan infants. J Nutr. 1997;127:1333–1338. - PubMed
    1. Beyersmann D, Haase H. Functions of zinc in signaling, proliferation and differentiation of mammalian cells. Biometals. 2001;14:331–341. doi: 10.1023/A:1012905406548. - DOI - PubMed
    1. Blume-Jensen P, Janknecht R, Hunter T. The kit receptor promotes cell survival via activation of PI 3-kinase and subsequent Akt-mediated phosphorylation of Bad on Ser136. Curr Biol. 1998;8:779–782. doi: 10.1016/S0960-9822(98)70302-1. - DOI - PubMed
    1. Bradford MM. A rapid and sensitive method for the quantitation of microgram quantities of protein utilizing the principle of protein-dye binding. Anal Biochem. 1976;72:248–254. doi: 10.1016/0003-2697(76)90527-3. - DOI - PubMed

Publication types

MeSH terms