. 2009 Dec;62(6):1414-22.
doi: 10.1002/mrm.22155.

Assessment of the effects of cellular tissue properties on ADC measurements by numerical simulation of water diffusion

Affiliations

Assessment of the effects of cellular tissue properties on ADC measurements by numerical simulation of water diffusion

Kevin D Harkins et al. Magn Reson Med. 2009 Dec.

Abstract

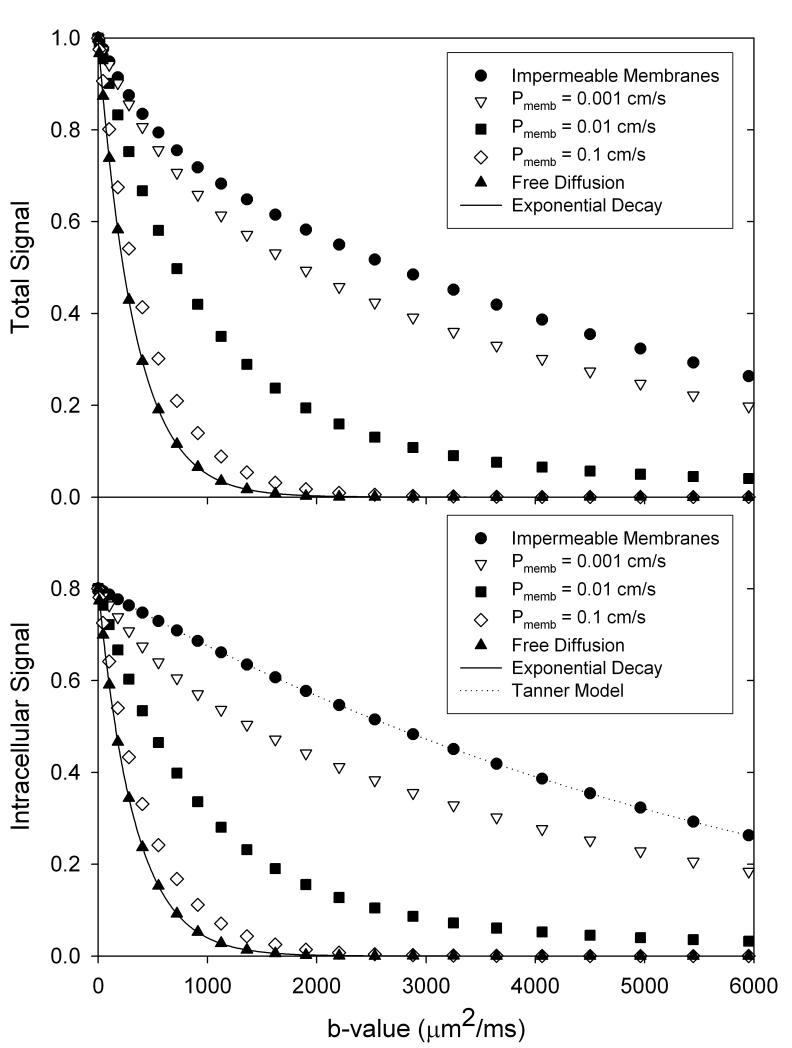
The apparent diffusion coefficient (ADC), as measured by diffusion-weighted MRI, has proven useful in the diagnosis and evaluation of ischemic stroke. The ADC of tissue water is reduced by 30-50% following ischemia and provides excellent contrast between normal and affected tissue. Despite its clinical utility, there is no consensus on the biophysical mechanism underlying the reduction in ADC. In this work, a numerical simulation of water diffusion is used to predict the effects of cellular tissue properties on experimentally measured ADC. The model indicates that the biophysical mechanisms responsible for changes in ADC postischemia depend upon the time over which diffusion is measured. At short diffusion times, the ADC is dependent upon the intrinsic intracellular diffusivity, while at longer, clinically relevant diffusion times, the ADC is highly dependent upon the cell volume fraction. The model also predicts that at clinically relevant diffusion times, the 30-50% drop in ADC after ischemia can be accounted for by cell swelling alone when intracellular T(2) is allowed to be shorter than extracellular T(2).


Figures

Figure 1
Figure 1
Schematic of the FD model geometry. (a) Tissue is modeled by cubic cells separated by extracellular space. The simulation boundary is extended in the diffusion direction such that an insignificant amount of water reaches the boundary during the simulation, while perpendicular boundaries are reflective due to geometric symmetry. (b) Cells are overlaid on a Cartesian mesh of grid points on which Eqn. 1 is approximated. The model considers seven tissue parameters including cell size (Lcell), cell separation (Lsep), membrane permeability (Pmem), intracellular and extracellular diffusivities (Dint and Dext), and intracellular and extracellular T2 relaxation times (T2int and T2ext).
Figure 2
Figure 2
Achematic of the diffusion weighted spin-echo pulse sequence considered in the FD model. Signal decay occurs due to molecular diffusion between the two diffusion gradients, while T2 decay occurs throughout the experiment.
Figure 3
Figure 3
Total signal and intracellular signal vs. b-value at various membrane permeabilities. Simulation results (symbols) for total and intracellular signal decay correspond to an exponential decay (solid line) in the case of free diffusion, while the intracellular signal decay also satisfies the Tanner et al. model (dotted line) in the case of impermeable membranes.
Figure 4
Figure 4
Calculated ADC of water plotted against membrane permeability. Lines connect simulations with identical diffusion times. Panels depict simulation results with a combination of parameters Dint = 1.0 and 3.0 μm2/ms, and T2int = 150, 50, and 25 ms. In each case, Dext = 3.0 μm2/ms, and T2ext = 150 ms. Shaded regions highlight the physiologically relevant values of membrane permeability.
Figure 5
Figure 5
Calculated ADC as a function of intracellular diffusivity, Dint, at different diffusion times. Simulations show that the ADC is relatively independent of Dint at clinically relevant diffusion times (Δ > 40 ms). The increase in ADC with lower T2int is a result of T2 filtering.
Figure 6
Figure 6
Calculated ADC as a function of intracellular T2 relaxation time, T2int. Simulations show an increase in the ADC with decreased T2int due to T2 filtering. Changes in Dint affect the ADC at short diffusion times, but do not affect the ADC at longer diffusion times.
Figure 7
Figure 7
Calculated ADC as a function of intracellular volume fraction, IVF. IVF is increased by swelling cells at the expense of the extracellular space. Simulations show that the ADC decreases with IVF, which is more pronounced at low T2int.
Figure 8
Figure 8
Calculated ADC as a function of TE. Different panels show results at different diffusion times, while lines are connected between ADCs with identical cell properties. T2 filtering is observed as an increase in ADC with TE. The increase is more pronounced with larger differences between intracellular and extracellular T2.

References

    1. Torrey HC. Bloch Equations with Diffusion Terms. Physical Review. 1956;104(3):563.
    1. Warach S, Chien D, Li W, Ronthal M, Edelman RR. Fast magnetic resonance diffusion-weighted imaging of acute human stroke. Neurology. 1992;42(9):1717. - PubMed
    1. Moseley ME, Cohen Y, Mintorovitch J, Chileuitt L, Shimizu H, Kucharczyk J, Wendland MF, Weinstein PR. Early detection of regional cerebral ischemia in cats: Comparison of diffusion- and T2-weighted MRI and spectroscopy. Magnetic Resonance in Medicine. 1990;14(2):330–346. - PubMed
    1. Warach S, Gaa J, Siewert B, Wielopolski P, Edelman RR. Acute human stroke studied by whole brain echo planar diffusion-weighted magnetic resonance imaging. Annals of Neurology. 1995;37(2):231–241. - PubMed
    1. van der Toorn A, Dijkhuizen RM, Tulleken CAF, Nicolay K. Diffusion of metabolites in normal and ischemic rat brain measured by localized 1H MRS. Magnetic Resonance in Medicine. 1996;36(6):914–922. - PubMed

Publication types