

Sparse canonical correlation analysis for identifying, connecting and completing gene-expression networks
- PMID: 19785734
- PMCID: PMC2760886
- DOI: 10.1186/1471-2105-10-315
Sparse canonical correlation analysis for identifying, connecting and completing gene-expression networks
Abstract
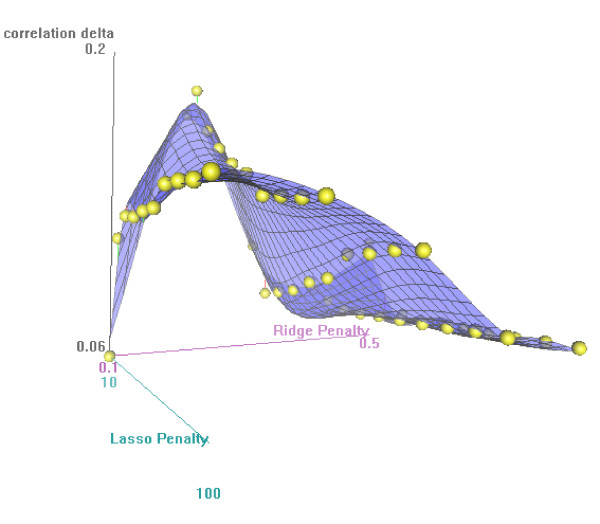
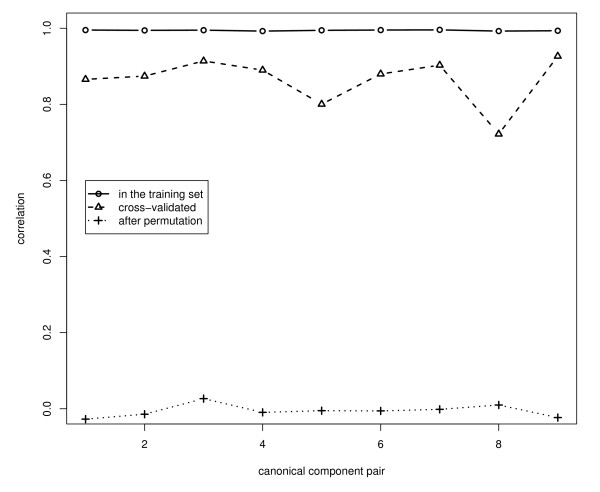
Background: We generalized penalized canonical correlation analysis for analyzing microarray gene-expression measurements for checking completeness of known metabolic pathways and identifying candidate genes for incorporation in the pathway. We used Wold's method for calculation of the canonical variates, and we applied ridge penalization to the regression of pathway genes on canonical variates of the non-pathway genes, and the elastic net to the regression of non-pathway genes on the canonical variates of the pathway genes.
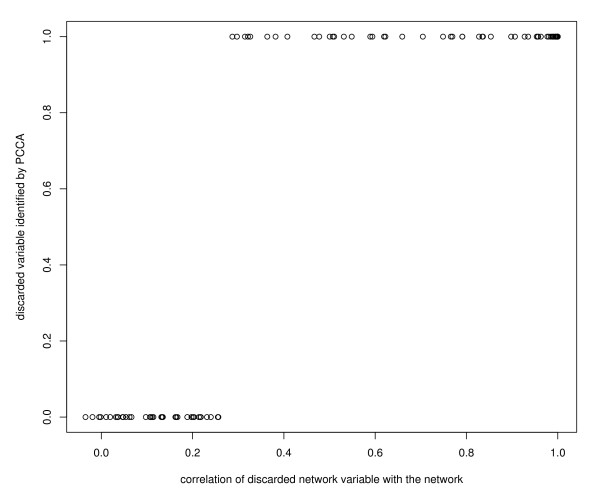
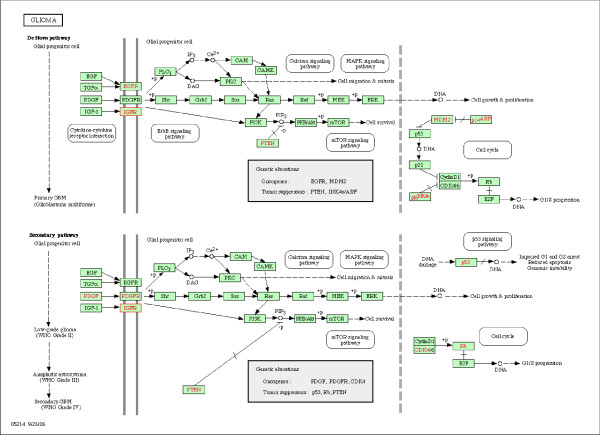
Results: We performed a small simulation to illustrate the model's capability to identify new candidate genes to incorporate in the pathway: in our simulations it appeared that a gene was correctly identified if the correlation with the pathway genes was 0.3 or more. We applied the methods to a gene-expression microarray data set of 12, 209 genes measured in 45 patients with glioblastoma, and we considered genes to incorporate in the glioma-pathway: we identified more than 25 genes that correlated > 0.9 with canonical variates of the pathway genes.
Conclusion: We concluded that penalized canonical correlation analysis is a powerful tool to identify candidate genes in pathway analysis.
Figures
References
-
- Doherty P, Kertes S, Magnusson M, Szalas A. Towards a logical analysis of biochemical pathways. Lecture notes in computer science. 2004;3229:667–679.
MeSH terms
LinkOut - more resources
Full Text Sources
