Convergence of linkage, gene expression and association data demonstrates the influence of the RAR-related orphan receptor alpha (RORA) gene on neovascular AMD: a systems biology based approach
- PMID: 19786043
- PMCID: PMC2884392
- DOI: 10.1016/j.visres.2009.09.016
Convergence of linkage, gene expression and association data demonstrates the influence of the RAR-related orphan receptor alpha (RORA) gene on neovascular AMD: a systems biology based approach
Abstract
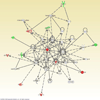
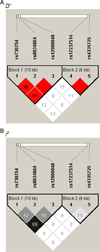
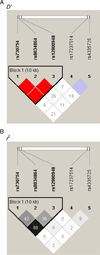
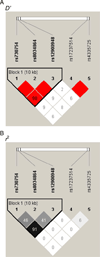
To identify novel genes and pathways associated with AMD, we performed microarray gene expression and linkage analysis which implicated the candidate gene, retinoic acid receptor-related orphan receptor alpha (RORA, 15q). Subsequent genotyping of 159 RORA single nucleotide polymorphisms (SNPs) in a family-based cohort, followed by replication in an unrelated case-control cohort, demonstrated that SNPs and haplotypes located in intron 1 were significantly associated with neovascular AMD risk in both cohorts. This is the first report demonstrating a possible role for RORA, a receptor for cholesterol, in the pathophysiology of AMD. Moreover, we found a significant interaction between RORA and the ARMS2/HTRA1 locus suggesting a novel pathway underlying AMD pathophysiology.
Copyright 2009 Elsevier Ltd. All rights reserved.
Conflict of interest statement
The authors have no conflict of interest in any materials presented in the article.
Figures


Similar articles
-
Prospective study of common variants in the retinoic acid receptor-related orphan receptor α gene and risk of neovascular age-related macular degeneration.Arch Ophthalmol. 2010 Nov;128(11):1462-71. doi: 10.1001/archophthalmol.2010.261. Arch Ophthalmol. 2010. PMID: 21060049 Free PMC article.
-
Influence of ROBO1 and RORA on risk of age-related macular degeneration reveals genetically distinct phenotypes in disease pathophysiology.PLoS One. 2011;6(10):e25775. doi: 10.1371/journal.pone.0025775. Epub 2011 Oct 6. PLoS One. 2011. PMID: 21998696 Free PMC article.
-
Analyses of single nucleotide polymorphisms and haplotype linkage of LOC387715 and the HTRA1 gene in exudative age-related macular degeneration in a Chinese cohort.Retina. 2009 Jul-Aug;29(7):974-9. doi: 10.1097/IAE.0b013e3181a3b90e. Retina. 2009. PMID: 19491722
-
LOC387715/HTRA1 gene polymorphisms and susceptibility to age-related macular degeneration: A HuGE review and meta-analysis.Mol Vis. 2010 Oct 5;16:1958-81. Mol Vis. 2010. PMID: 21031019 Free PMC article. Review.
-
10q26 - The enigma in age-related macular degeneration.Prog Retin Eye Res. 2023 Sep;96:101154. doi: 10.1016/j.preteyeres.2022.101154. Epub 2022 Dec 10. Prog Retin Eye Res. 2023. PMID: 36513584 Review.
Cited by
-
GWAS in a box: statistical and visual analytics of structured associations via GenAMap.PLoS One. 2014 Jun 6;9(6):e97524. doi: 10.1371/journal.pone.0097524. eCollection 2014. PLoS One. 2014. PMID: 24905018 Free PMC article.
-
CFH (rs1061170, rs1410996), KDR (rs2071559, rs1870377) and KDR and CFH Serum Levels in AMD Development and Treatment Efficacy.Biomedicines. 2024 Apr 24;12(5):948. doi: 10.3390/biomedicines12050948. Biomedicines. 2024. PMID: 38790910 Free PMC article.
-
Exploring the Therapeutic Potential of Elastase Inhibition in Age-Related Macular Degeneration in Mouse and Human.Cells. 2023 May 3;12(9):1308. doi: 10.3390/cells12091308. Cells. 2023. PMID: 37174708 Free PMC article.
-
Geographic atrophy: pathophysiology and current therapeutic strategies.Front Ophthalmol (Lausanne). 2023 Dec 5;3:1327883. doi: 10.3389/fopht.2023.1327883. eCollection 2023. Front Ophthalmol (Lausanne). 2023. PMID: 38983017 Free PMC article. Review.
-
Genetics of age-related macular degeneration: current concepts, future directions.Semin Ophthalmol. 2011 May;26(3):77-93. doi: 10.3109/08820538.2011.577129. Semin Ophthalmol. 2011. PMID: 21609220 Free PMC article. Review.
References
-
- Abecasis GR, Yashar BM, Zhao Y, Ghiasvand NM, Zareparsi S, Branham KEH, Reddick AC, Trager EH, Yoshida S, Bahling J, Filippova E, Elner S, Johnson MW, Vine AK, Sieving PA, Jacobson SG, Richards JE, Swaroop A. Age-Related Macular Degeneration: A High-Resolution Genome Scan for Susceptibility Loci in a Population Enriched for Late-Stage Disease. 2004:482–494. - PMC - PubMed
-
- Allikmets R, Shroyer NF, Singh N, Seddon JM, Lewis RA, Bernstein PS, Peiffer A, Zabriskie NA, Li Y, Hutchinson A, Dean M, Lupski JR, Leppert M. Mutation of the Stargardt disease gene (ABCR) in age-related macular degeneration. Science. 1997;277:1805–1807. - PubMed
-
- Anderson DH, Mullins RF, Hageman GS, Johnson LV. A Role of Local Inflammation in the Formation of Drusen in the Aging Eye. 2002:411–431. - PubMed
Publication types
MeSH terms
Substances
Grants and funding
LinkOut - more resources
Full Text Sources
Other Literature Sources
Medical

