. 2009 Nov;89(11):1317-28.
doi: 10.1038/labinvest.2009.94. Epub 2009 Sep 28.

Paracrine induction of endothelium by tumor exosomes

Affiliations

Paracrine induction of endothelium by tumor exosomes

Joshua L Hood et al. Lab Invest. 2009 Nov.

Abstract

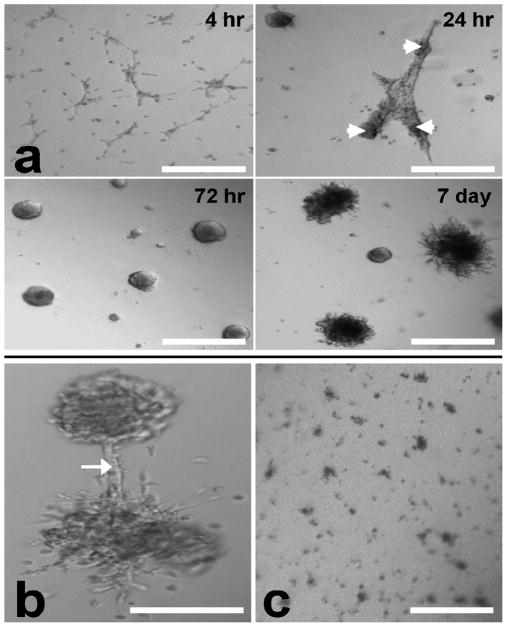
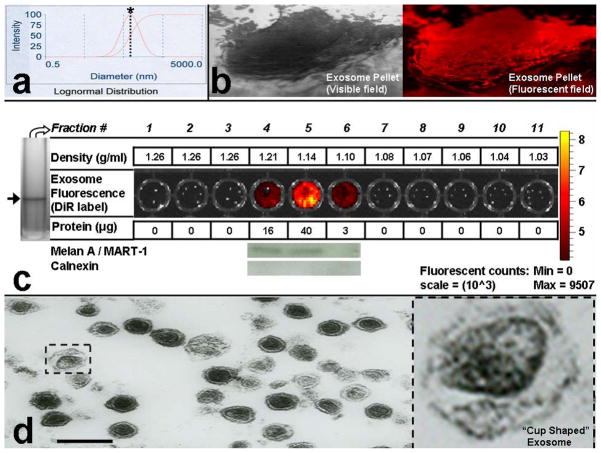
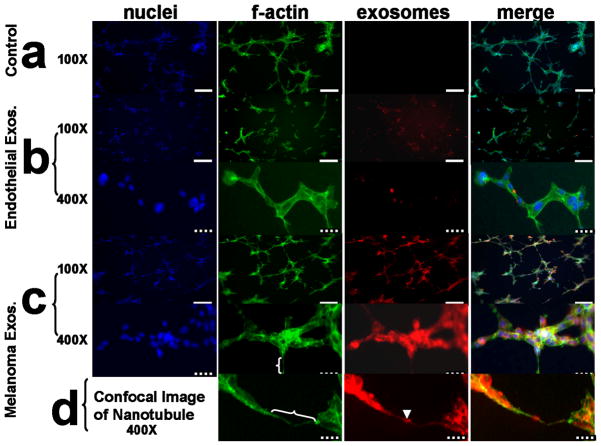
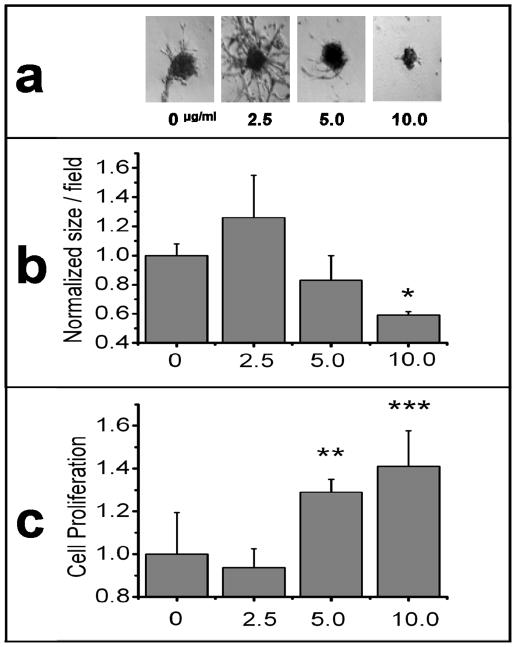
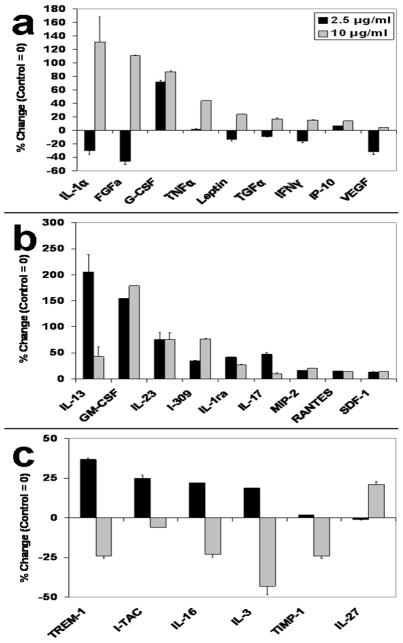
Cancers use a nanoscale messenger system known as exosomes to communicate with surrounding tissues and immune cells. However, the functional relationship between tumor exosomes, endothelial signaling, angiogenesis, and metastasis is poorly understood. Herein, we describe a standardized approach for defining the angiogenic potential of isolated exosomes. We created a powerful technique to rapidly and efficiently isolate and track exosomes for study using dynamic light scattering in conjunction with fluorescent exosome labeling. With these methods, melanoma exosomes were observed to interact with and influence endothelial tubule morphology as well as move between endothelial tubule cells by means of tunneling nanotube structures. Melanoma exosomes also were observed to rapidly stimulate the production of endothelial spheroids and endothelial sprouts in a dose-dependent manner. In concert, tumor exosomes simultaneously elicited paracrine endothelial signaling by regulation of certain inflammatory cytokines. These data suggest that, tumor exosomes can promote endothelial angiogenic responses, which could contribute to tumor metastatic potential.


Figures

Figure 1
Figure 1
2F-2B endothelial cells (50,000/well) spontaneously form spheroids on 3D matrigel as evidenced by phase contrast microscopy. (a) cells migrate into a lace-like network by 4 hrs. Endothelial tubules form and begin contracting into spheroids (arrowheads) by 24hrs. Formation of spheroids occurs following 72 hrs in culture. Circumferential spheroid sprouting is observed by 7 days. (b) Beyond 7 day culture, spheroids sprouts can form anastomotic connections (arrow). (c) In the presence of anti-angiogenic fumagillin nanoparticles for 72 hrs (final culture fumagillin concentration = 4 μM) spheroids fail to develop. Bar = 200 μm.
Figure 2
Figure 2
Isolation of B16-F10 melanoma exosomes. (a) Dynamic light scattering (DLS, Brookhaven Instruments Corp.) was used to confirm exosome isolation and size exosomes (prior to centrifugation at 100,000 × g to maximize accuracy by minimizing the measurement of exosome clusters). Exosome size distribution profile = bell shaped curve. Dotted line crosses the logarithmic sizing curve at * = 74 nm (s.dev. =13 nm, average of 24 individual measurements). (b) Exosome pellet visualized through a 70 Ti polycarbonate tube following differential centrifugation; 20 X magnification. Exosomes were treated with DiI prior to pellet formation and display red fluorescence via fluorescent microscopy; 20 X magnification. (c) DiR labeled B16 melanoma exosome flotation on a continuous sucrose gradient (2.0 – 0.25 M). Arrow = single blue exosome band (black and white image, DiR is blue in visible light wavelengths) band present in gradient fraction 5 of the SW 41 centrifuge tube. Exosome fractions were further evaluated for protein content and expression of Melan A or Calnexin marker proteins. (d) Transmission electron microscopy was used to confirm isolation of cup shaped (see blow up) B16 melanoma exosomes. Various exosome sizes ~50–100 nm are observed in concordance with DLS. Black scale bar = 200 nm.
Figure 3
Figure 3
Exosomes interact with and influence the morphology of 3D 2F-2B endothelial cell tubules as evidenced by fluorescent microscopy. (a) 2F-2B endothelial cells (100,000/chamber) cultured on matrigel for 24 hrs in the absence of exogenously labeled exosomes show no red background signal while f-actin is stained green. (b) endothelial cells (100,000/chamber) cultured on matrigel for 24 hrs in the presence of 20 μg/ml of 2F-2B endothelial cell exosomes demonstrate decreased tubule branching versus (a) and show exosome signal in red clusters within green f-actin stained endothelial tubules. (c) endothelial cells (100,000/chamber) cultured on matrigel for 24 hrs in the presence of 20 μg/ml of B16 melanoma exosomes demonstrate increased tubule branching versus (a) and show colocalization between exosome signal in red clusters and green f-actin stained endothelial tubules. (d) Confocal image of red exosome signal co-localized with green stained f-actin in a nanotube bridging two endothelial tubules. white brackets = nanotubes; arrowhead = exosome cluster within a nanotube; solid white bar = 200 μm; hatched bar = 40 μm. Blue fluorescence = DAPI (Vector labs), green = AlexaFluor 488 phalloidin (invitrogen), red = DiI (invitrogen).
Figure 4
Figure 4
Long Term Effects of varying B16-F10 melanoma exosome concentrations on 3D endothelial culture. 2F-2B endothelial cells (50,000/well) were cultured for 72 hrs to form spheroids followed by the addition of 0, 2.5, 5, or 10 μg/ml for 10 days to study the permanence of exosome effects on spheroid development. (a) phase contrast microscopy of representative spheroid morphology for each exosome dose. (b) ImageJ software was used to measure the area of individual spheroids in 40 X mag. fields (see supplemental information, Fig. S1). Average spheroid size/field was normalized against control (0 μg). ANOVA was used to calculate significance for p < 0.05 for a control of N = 48; * = p = 5.4×10^−5. Error bars represent the standard deviation of the average spheroid size from 3 random fields from different cultures. (c) XTT (tetrazolium salt) colorimetric reagent (MD Biosciences; St. Paul MN) was used to measure cell proliferation. Average endothelial cell proliferation was normalized against control (0 μg exosomes). ANOVA was used to calculate significance for p < 0.05 for a control of N = 4; ** = p = 5.9×10^−3 and *** = p = 2.9×10^−3. Error bars represent the standard deviation of N = 4 samples.
Figure 5
Figure 5
Melanoma exosomes modulate endothelial cytokine production. 2F-2B endothelial cells (50,000/well) were cultured for 72 hrs to form spheroids followed by the addition of 0, 2.5, or 10 μg/ml for 10 days to produce cytokines in the spheroid culture media. Three sets of culture media samples were collected and pooled for each exosome dosing group and analyzed using cytokine arrays. (a) TransSignal Mouse Angiogenesis Antibody Array (Panomics) or (b, c) Proteome Profiler Mouse Cytokine Array (R&D Systems). Cytokines levels are represented as a percent change over control (control = 0). The absolute change in level for each cytokine group (2.5 and 10 μg/ml melanoma exosomes) was averaged. The average of absolute changes for all cytokines was 41%. ANOVA analysis was used to calculate statistical significance. Cytokine levels that changed more than 10% from the absolute value average changes as compared to a normalized control group were considered to be affected by the experimental procedures, according to ANOVA that revealed statistical significance (p < 0.05) for difference from control in each case. The p values for 2.5, 10 and combined are 0.035, 0.016 and 0.001 respectively. Error bars = s.e.m. of replicates present on the arrays.

Comment in

  • Inside lab invest.
    [No authors listed] [No authors listed] Lab Invest. 2009 Nov;89(11):1190-1. doi: 10.1038/labinvest.2009.114. Lab Invest. 2009. PMID: 19861966 No abstract available.

References

    1. Schorey JS, Bhatnagar S. Exosome Function: From Tumor Immunology to Pathogen Biology. Traffic. 2008;9:871–881. - PMC - PubMed
    1. Admyre C, Johansson SM, Paulie S, Gabrielsson S. Direct exosome stimulation of peripheral human T cells detected by ELISPOT. Eur J Immunol. 2006;36:1772–1781. - PubMed
    1. Lakkaraju A, Rodriguez-Boulan E. Itinerant exosomes: emerging roles in cell and tissue polarity. Trends Cell Biol. 2008;18(5):199–209. - PMC - PubMed
    1. Iero M, Valenti R, Huber V, Filipazzi P, Parmiani G, Fais S, et al. Tumour-released exosomes and their implications in cancer immunity. Cell Death Differ. 2008;15(1):80–88. - PubMed
    1. Taylor DD, Gercel-Taylor C. Tumour-derived exosomes and their role in cancer-associated T-cell signalling defects. British Journal of Cancer. 2005;92:305–311. - PMC - PubMed

MeSH terms