

The mechanochemistry of endocytosis
- PMID: 19787029
- PMCID: PMC2742711
- DOI: 10.1371/journal.pbio.1000204
The mechanochemistry of endocytosis
Abstract
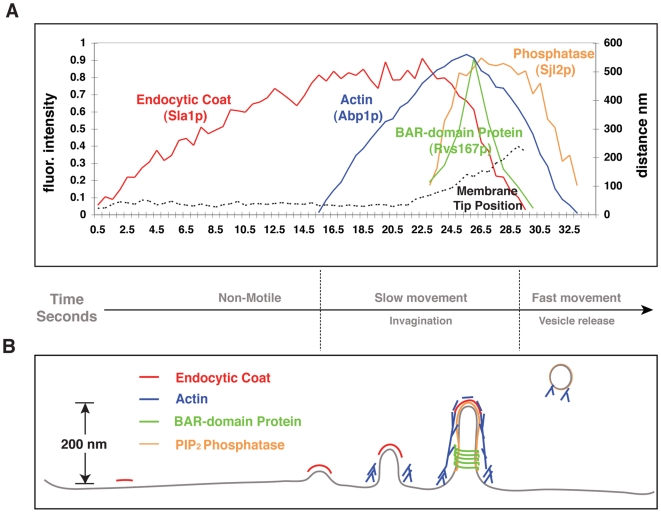
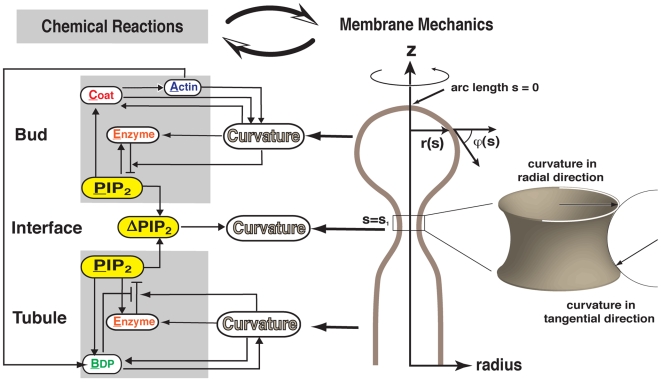
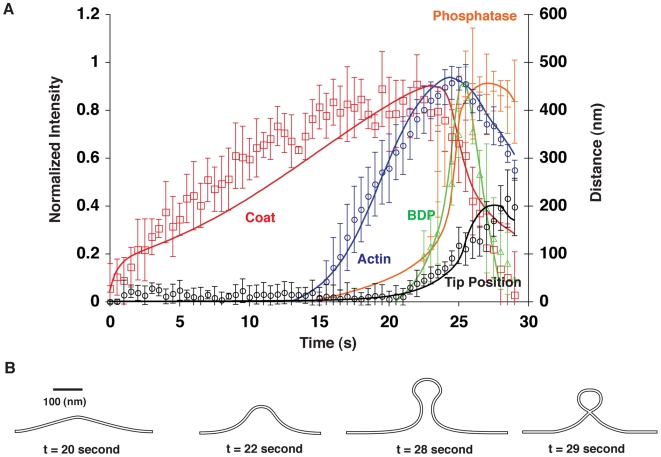
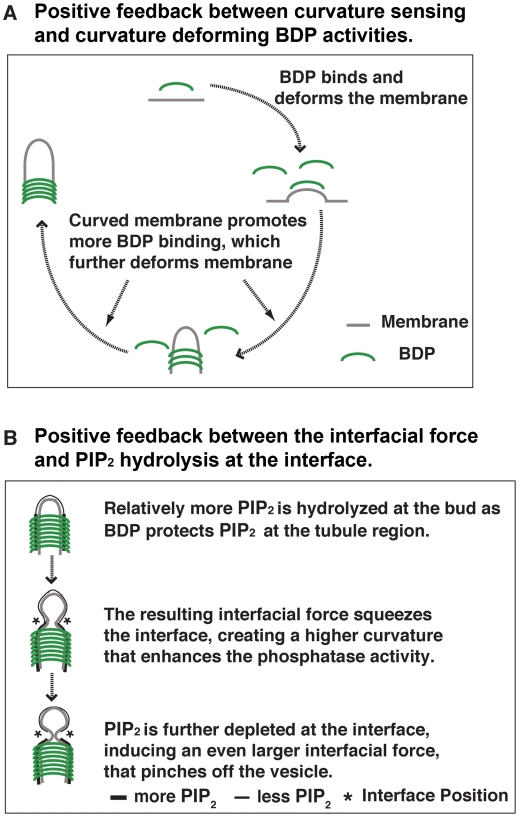
Endocytic vesicle formation is a complex process that couples sequential protein recruitment and lipid modifications with dramatic shape transformations of the plasma membrane. Although individual molecular players have been studied intensively, how they all fit into a coherent picture of endocytosis remains unclear. That is, how the proper temporal and spatial coordination of endocytic events is achieved and what drives vesicle scission are not known. Drawing upon detailed knowledge from experiments in yeast, we develop the first integrated mechanochemical model that quantitatively recapitulates the temporal and spatial progression of endocytic events leading to vesicle scission. The central idea is that membrane curvature is coupled to the accompanying biochemical reactions. This coupling ensures that the process is robust and culminates in an interfacial force that pinches off the vesicle. Calculated phase diagrams reproduce endocytic mutant phenotypes observed in experiments and predict unique testable endocytic phenotypes in yeast and mammalian cells. The combination of experiments and theory in this work suggest a unified mechanism for endocytic vesicle formation across eukaryotes.
Conflict of interest statement
The authors have declared that no competing interests exist.
Figures
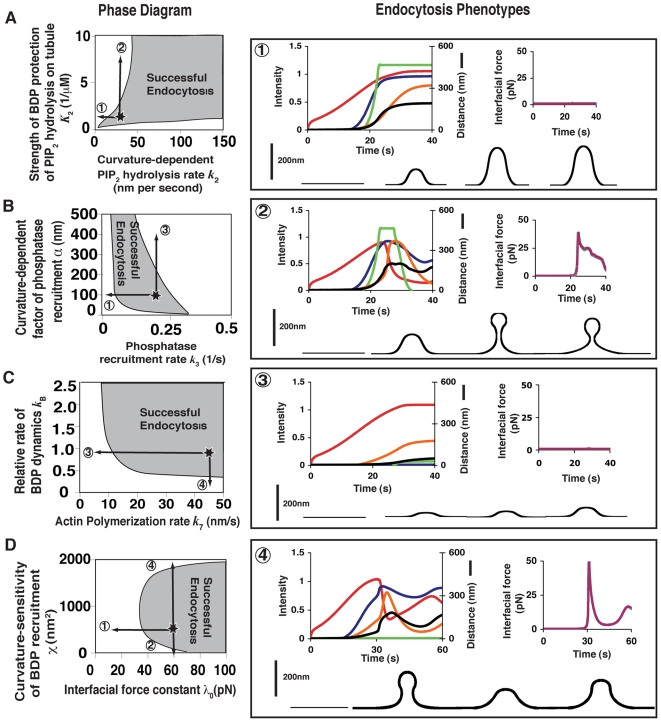
 increases from
  to
to  ]. Phenotype 3: Increased phosphatase recruitment rate [α increases from 100 nm to 500 nm]. Phenotype 4: BDP recruitment does not occur.
Comment in
-
Wrapping our heads around endocytosis.PLoS Biol. 2009 Sep 29;7(9):e1000207. doi: 10.1371/journal.pbio.1000207. PLoS Biol. 2009. PMID: 20076755 Free PMC article. No abstract available.
References
-
- Conner S. D, Schmid S. L. Regulated portals of entry into the cell. Nature. 2003;422:37–44. - PubMed
-
- Merrifield C. J. Seeing is believing: imaging actin dynamics at single sites of endocytosis. Trends Cell Biol. 2004;14:352–358. - PubMed
-
- Jonsdottir G. A, Li R. Dynamics of yeast myosin I: evidence for a possible role in scission of endocytic vesicles. Curr Biol. 2004;14:1604–1609. - PubMed
-
- Galletta B. J, Chuang D. Y, Cooper J. A. Distinct roles for Arp2/3 regulators in actin assembly and endocytosis. PLoS Biology. 2008;6:e1. doi: 10.1371/journal.pbio.0060001. - DOI - PMC - PubMed
Publication types
MeSH terms
Substances
Grants and funding
LinkOut - more resources
Full Text Sources
Other Literature Sources
Molecular Biology Databases
