. 2009 Sep;7(9):e1000205.
doi: 10.1371/journal.pbio.1000205. Epub 2009 Sep 29.

Exploration of uncharted regions of the protein universe

Affiliations

Exploration of uncharted regions of the protein universe

Lukasz Jaroszewski et al. PLoS Biol. 2009 Sep.

Abstract

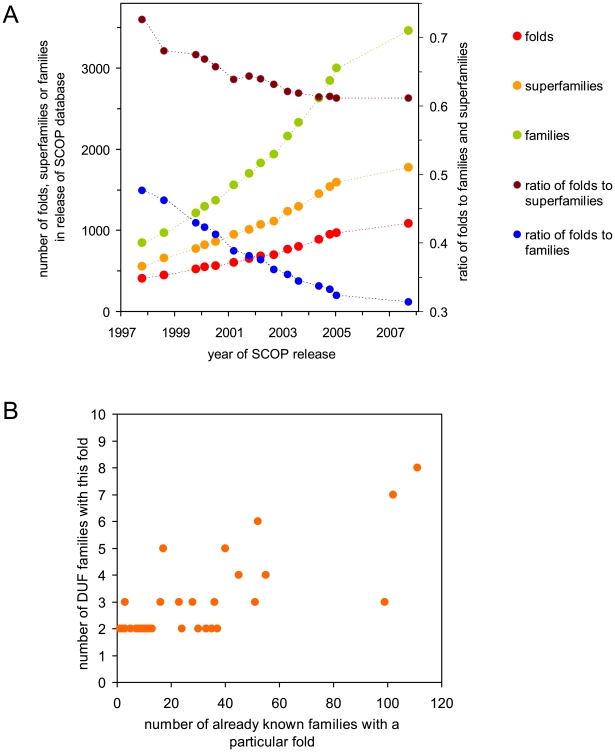
The genome projects have unearthed an enormous diversity of genes of unknown function that are still awaiting biological and biochemical characterization. These genes, as most others, can be grouped into families based on sequence similarity. The PFAM database currently contains over 2,200 such families, referred to as domains of unknown function (DUF). In a coordinated effort, the four large-scale centers of the NIH Protein Structure Initiative have determined the first three-dimensional structures for more than 250 of these DUF families. Analysis of the first 248 reveals that about two thirds of the DUF families likely represent very divergent branches of already known and well-characterized families, which allows hypotheses to be formulated about their biological function. The remainder can be formally categorized as new folds, although about one third of these show significant substructure similarity to previously characterized folds. These results infer that, despite the enormous increase in the number and the diversity of new genes being uncovered, the fold space of the proteins they encode is gradually becoming saturated. The previously unexplored sectors of the protein universe appear to be primarily shaped by extreme diversification of known protein families, which then enables organisms to evolve new functions and adapt to particular niches and habitats. Notwithstanding, these DUF families still constitute the richest source for discovery of the remaining protein folds and topologies.


Conflict of interest statement

The authors have declared that no competing interests exist.

Figures

Figure 1
Figure 1. The number of DUF structures solved by PSI centers (continuous red line) and by other laboratories (dashed red line).
For comparison, the contribution of the PSI centers to structural determination of PFAM protein families is shown as a continuous blue line and by other laboratories as a dashed blue line.
Figure 2
Figure 2. Distribution and sizes of DUF families.
(A) Distribution of DUF families in the kingdoms of life. An “A” denotes families present in Archaea, “B” denotes Bacteria, “E” Eukaryota, and “V” Viruses. “B,E” denotes families present in both Bacteria and in Eukaryota and so forth. (B) Distribution of sizes of DUF families according to the PFAM database. Green bars show number of family members found in the NR database (without metagenomic sequences), and blue bars indicate additional members found in metagenomic datasets.
Figure 3
Figure 3. Structural and functional characterization of DUF families.
(A) Distribution of DUF structures with regard to structural similarity and homology to previously known structures. The main pie chart shows overall percentages of DUF families with new folds, new folds partially similar to previously known folds, putative analogs, putative homologs, and recognizable homologs. The inset pie charts show the percentage of DUF families with proposed hypothesis about function in each of these six categories. (B) Impact of solved structures on hypotheses about function proposed for DUF families. (C) Distribution of Cα RMSD versus number of equivalent residues in structural alignments between first structural representatives of DUF families and the closest previously solved structures of the same fold. Dark blue circles indicate pairs with detectable sequence homology (recognizable homologs). Pairs with marginal homology confirmed by the solved structure (putative homologs) are shown by bright blue circles. Pairs with unresolved homology are shown as green circles. As expected, structural alignments of pairs with detectable homology tend to be longer and Cα RMSD values tend to be lower. For illustration, we also show the same data for 20 partial similarities between new folds found in DUF structures and previously known folds (orange circles). We note that, by definition, the set of partial similarities is limited to pairs with more than 50 equivalent residues and Cα RMSD below 3 Å.
Figure 4
Figure 4. Analysis of trends in families, superfamilies, and DUFs.
(A) Long-term trends in the proportion of protein folds to protein families and to protein superfamilies according to SCOP database. Each point corresponds to one release SCOP database (n.b., there were no SCOP releases between January 2005 and September 2007). This analysis is based on the data available from the SCOP website (http://scop.mrc-lmb.cam.ac.uk/scop/). (B) Number of fold representatives in DUF families as a function of a number of already known families with the same fold (n.b., the number of known families of the same fold was derived from the SCOP database).
Figure 5
Figure 5. Evidence of saturation of protein fold space as a function of time.
With growing number of folds, the percentage of folds with partial structural similarity to other folds is increasing, and hence, the number of truly new folds being discovered is rapidly decreasing. Folds were added in historical order in groups of 100 and the percentage of folds with partial similarity to any previously solved fold was calculated for each group. All cases in which FATCAT algorithm found at least 50 equivalent residues superimposed with Cα RMSD <3 Å were regarded as putative cases of “significant partial similarity” and were subject to visual verification. As indicated by a box on the graph, 30% of new folds from DUF families described here show such partial similarities to other protein folds.
Figure 6
Figure 6. Examples of structural similarities detected in sub-domains of different folds, as classified by the SCOP database.
The leftmost column shows the first structure from each pair of partially similar structures, and the rightmost column shows the second structure from each pair. The central column contains structural superposition of each pair. A region of structurally equivalent residues identified by FATCAT is indicated by an red contoured box .

Comment in

  • Charting an unknown protein universe.
    Heller K. Heller K. PLoS Biol. 2009 Sep 29;7(9):e1000206. doi: 10.1371/journal.pbio.1000206. PLoS Biol. 2009. PMID: 20076754 Free PMC article. No abstract available.

References

    1. Gerdes S, Edwards R, Kubal M, Fonstein M, Stevens R, et al. Essential genes on metabolic maps. Curr Opin Biotechnol. 2006;17:448–456. - PubMed
    1. Hashimoto M, Ichimura T, Mizoguchi H, Tanaka K, Fujimitsu K, et al. Cell size and nucleoid organization of engineered Escherichia coli cells with a reduced genome. Mol Microbiol. 2005;55:137–149. - PubMed
    1. Fan J. B, Chee M. S, Gunderson K. L. Highly parallel genomic assays. Nat Rev Genet. 2006;7:632–644. - PubMed
    1. Amos C. I. Successful design and conduct of genome-wide association studies. Hum Mol Genet. 2007;16 Spec No. 2:R220–R225. - PMC - PubMed
    1. Seng K. C, Seng C. K. The success of the genome-wide association approach: a brief story of a long struggle. Eur J Hum Genet. 2008;16:554–564. - PubMed

Publication types