. 2009 Sep 29;4(9):e7222.
doi: 10.1371/journal.pone.0007222.

Roles of specific membrane lipid domains in EGF receptor activation and cell adhesion molecule stabilization in a developing olfactory system

Affiliations

Roles of specific membrane lipid domains in EGF receptor activation and cell adhesion molecule stabilization in a developing olfactory system

Nicholas J Gibson et al. PLoS One. .

Abstract

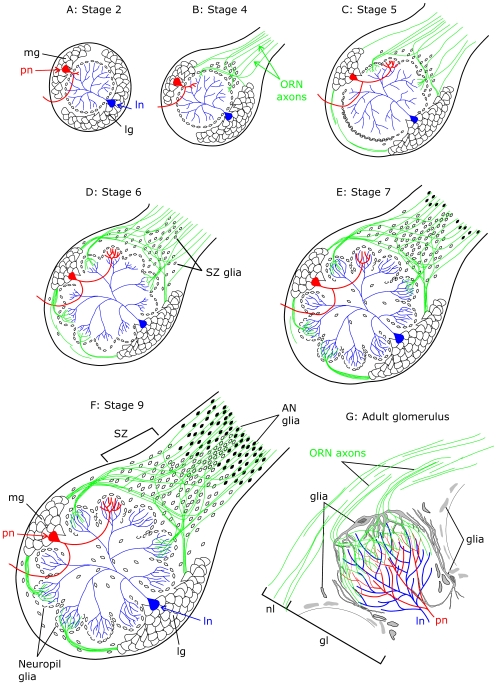
Background: Reciprocal interactions between glial cells and olfactory receptor neurons (ORNs) cause ORN axons entering the brain to sort, to fasciculate into bundles destined for specific glomeruli, and to form stable protoglomeruli in the developing olfactory system of an experimentally advantageous animal species, the moth Manduca sexta. Epidermal growth factor receptors (EGFRs) and the cell adhesion molecules (IgCAMs) neuroglian and fasciclin II are known to be important players in these processes.

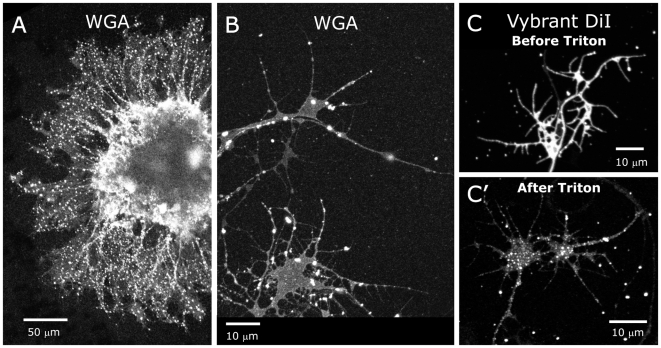
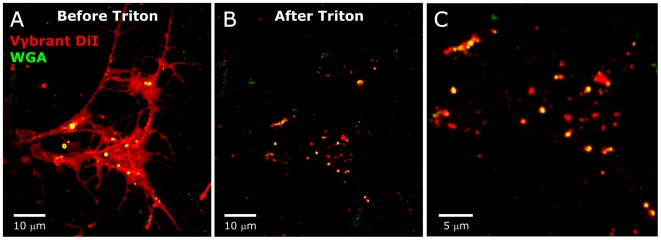
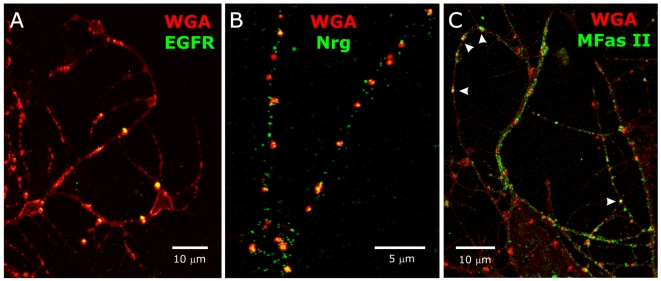
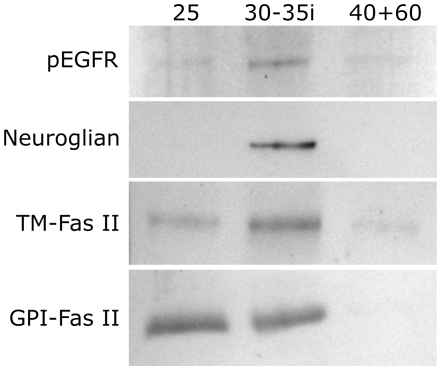
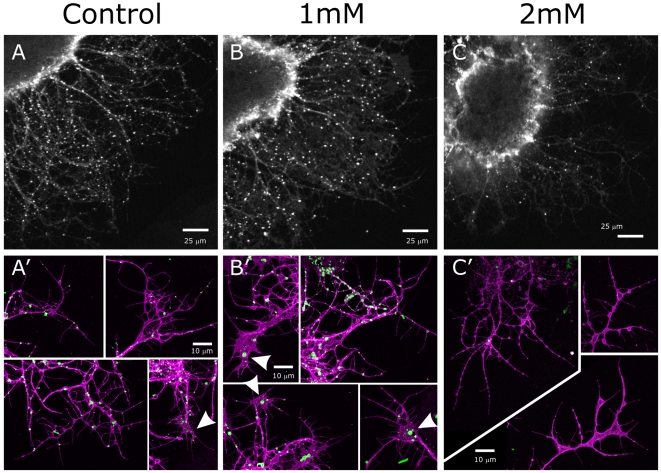
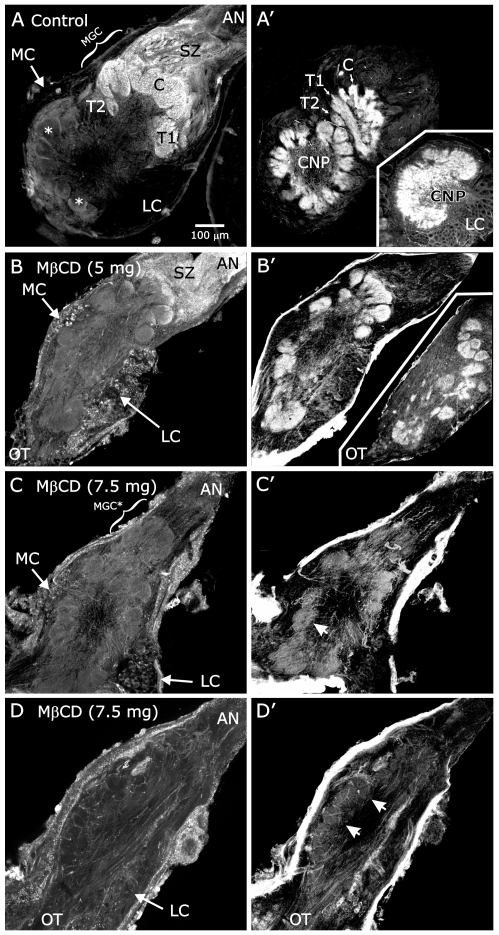
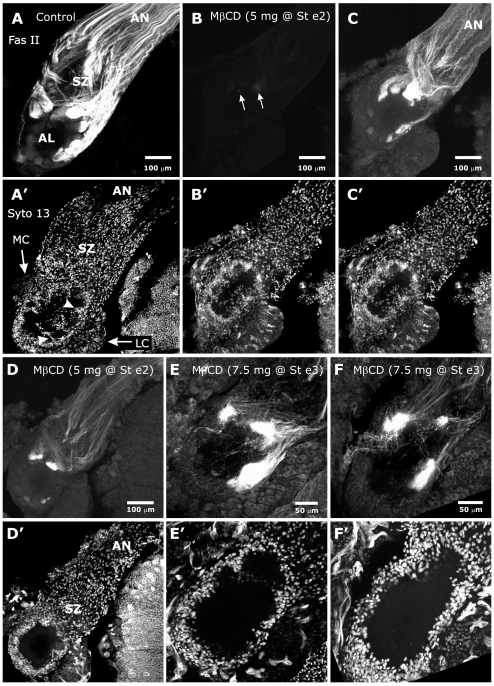
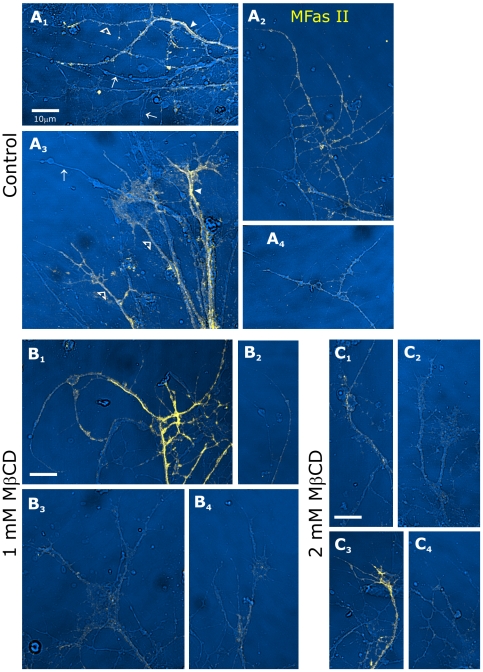
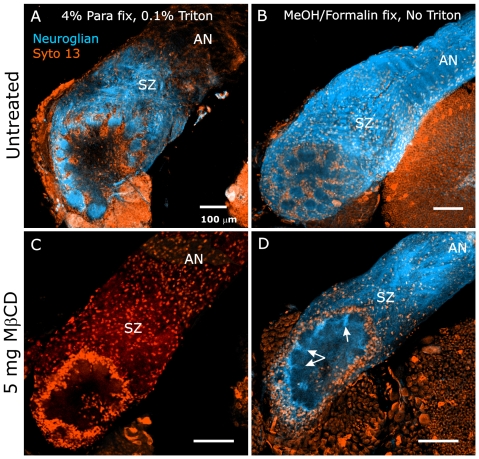
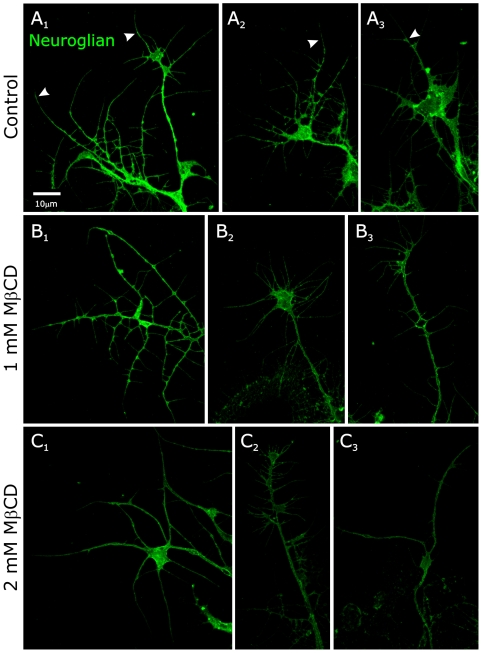
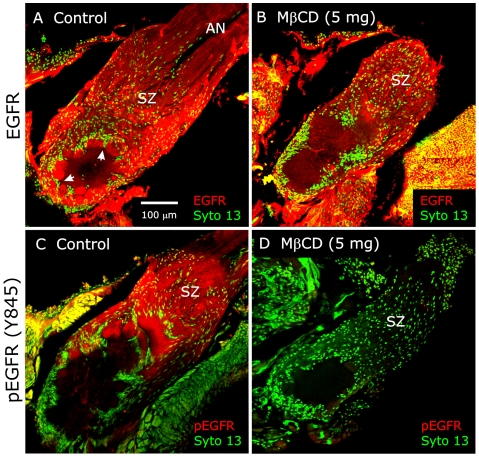
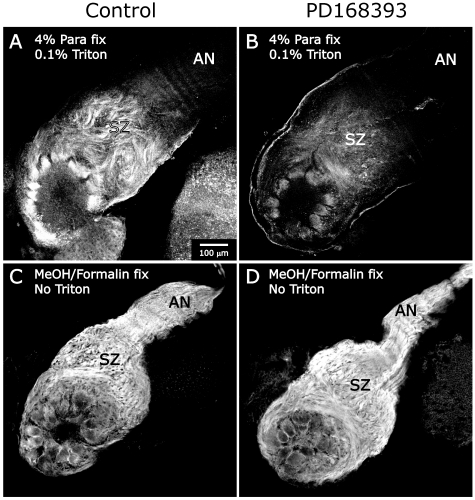
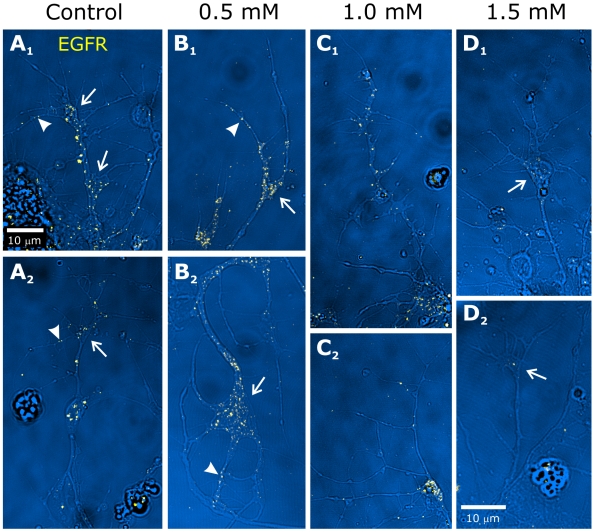
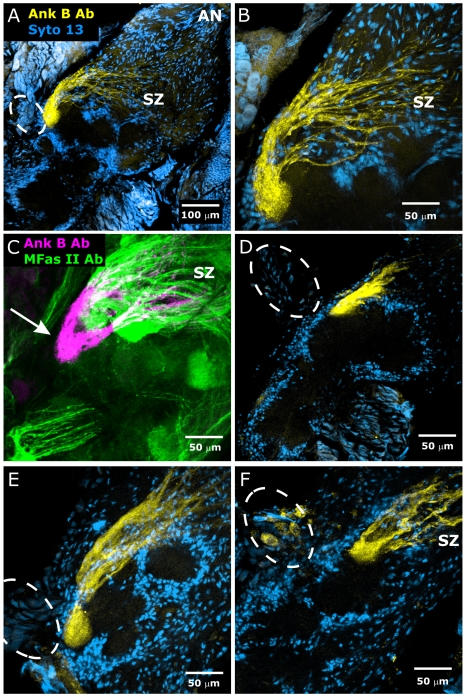
Methodology/principal findings: We report in situ and cell-culture studies that suggest a role for glycosphingolipid-rich membrane subdomains in neuron-glia interactions. Disruption of these subdomains by the use of methyl-beta-cyclodextrin results in loss of EGFR activation, depletion of fasciclin II in ORN axons, and loss of neuroglian stabilization in the membrane. At the cellular level, disruption leads to aberrant ORN axon trajectories, small antennal lobes, abnormal arrays of olfactory glomerul, and loss of normal glial cell migration.

Conclusions/significance: We propose that glycosphingolipid-rich membrane subdomains (possible membrane rafts or platforms) are essential for IgCAM-mediated EGFR activation and for anchoring of neuroglian to the cytoskeleton, both required for normal extension and sorting of ORN axons.


Conflict of interest statement

Competing Interests: The authors have declared that no competing interests exist.

Figures

Figure 1
Figure 1. Schematic diagram of antennal lobe development in Manduca sexta.
A: At stage 2 of development, prior to arrival of ORN axons from the antennae, the nascent AL consists of a medial group (mg) of projection neurons (pn, one shown in red), a lateral group (lg) comprising local interneurons (ln, one shown in blue), uniglomerular projection neurons, and multiglomerular projection neurons, and AL glia (small cells) surrounding a coarse neuropil. B: The first ORN axons (green) arrive at stage 4. The axons induce a subset of glial cells to proliferate and migrate outward toward the ingrowing axons to form a sorting zone at the base of the antennal nerve. C: By stage 5, ORN axons arriving at the sorting zone are induced to disassociate from other axons, change course dramatically, and refasciculate with other axons targeting common glomeruli. ORN axons penetrate the layer of glial cells, their terminal branches form glomerular arborizations called “protoglomeruli,” and the glial cells begin to migrate to surround them. Dendrites of the medial cluster projection neurons begin to extend into the forming glomeruli. D, E: During stages 6 and 7, ORN axons continue to arrive, projection neurons and now local interneurons extend their dendrites into the glomeruli, and glial cells continue to migrate to surround the glomeruli. F: By stage 9 the antennal lobe architecture is established. G: A single adult glomerulus. ORN axons traveling in the nerve layer (nl) turn sharply to innervate the apical half of a glomerulus in the glomerular layer (gl). ln and pn dendrites cross the basal border of the glomerulus, arborize, and form synaptic contacts with ORNs and each other mainly in the basal two-thirds of the glomerular neuropil. Glial cells of the simple type (75–100/glomerulus) form a sheath around the glomerulus (the processes of several are shown), while complex glial cells (<10/glomerulus) extend processes into the glomerular neuropil, arborizing in the most apical and in the basal portion of the glomerulus .
Figure 2
Figure 2. Glycosphingolipids and detergent-resistant patches on ORN axons.
A: Explants of antennal olfactory epithelium labeled for glycosphingolipids (GSLs) using the lectin wheat germ agglutinin (WGA). Patchy labeling suggests that GSLs are confined to membrane subdomains. B: Higher magnification of axons and growth cones of another 24-hour culture. Patches of WGA labeling extends into growth cone filopodia. C: Individual neurons labeled with Vybrant DiI, which uniformly labels cell membranes. C′: Neurons re-imaged after treatment with 0.5% Triton X-100 at 4°C to extract the dye from phospholipid membranes but not from detergent-resistant membranes show patchy labeling indicative of membrane rafts.
Figure 3
Figure 3. WGA colocalizes with Triton-resistant Vybrant DiI.
A: Explants of antennal sensory epithelium. Vybrant DiI (red) and WGA-Alexa 633 (green). B: Re-imaging after treatment with 0.5% Triton at 4°C shows WGA labeling only where Triton-resistant Vybrant DiI remains. C: Higher magnification reveals a population of Triton-resistant Vybrant DiI-labeled patches with no detectable WGA labeling.
Figure 4
Figure 4. Co-localization of WGA-labeled patches and various signaling molecules expressed by ORN axons.
24 hrs in vitro. ORN axons extend from explants outside of the field of view. A: Co-labeling with WGA-rhodamine (red) and an anti-EGFR antibody (sc-15827, green): EGFRs are localized exclusively to WGA-labeled domains. B: Co-labeling with WGA-rhodamine (red) and an anti-neuroglian (Nrg) antibody (3B11, green): neuroglian molecules exist both in and out of WGA-labeled patches. C: Co-labeling with WGA-rhodamine (red) and an anti-MFas II antibody (C3, green): most MFas II molecules are located outside of WGA-labeled patches. Arrowheads show regions of co-localization.
Figure 5
Figure 5. EGFR and IgCAM localization probed by sucrose gradient flotation of detergent resistant membranes.
ALs were separated from brains and homogenized separately. Detergent-resistant and detergent-soluble membranes were separated by sucrose step-gradient flotation. Detergent resistant membranes were found in the 25% sucrose layer and at the 30−35% sucrose interface, while detergent soluble membranes were found in the 40 and 60% sucrose layers. Associated proteins were separated via PAGE and transferred to a PVDF membrane for immunoblotting. Using an antibody to activated EGFR, dimers (250 kDa) were found mostly in a detergent-resistant fraction at the 30−35% sucrose interface, smaller amounts were found in the 25% and 40+60% sucrose layers. For blots probed with an antibody to M sexta neuroglian, only the 30−35% sucrose interface fraction produced a band. As for the pEGFR blot, the TM-Fas II blot produced bands for all three fractions, with the 30−35% interface labeled more intensely than the other two fractions. An antibody to GPI-linked Fasciclin II, expected to be raft-associated by virtue of its GPI anchor, labeled only the 25% sucrose and the 30-35% sucrose interface fractions.
Figure 6
Figure 6. MβCD treatment alters the distribution of GSL-rich membrane subdomains.
Control and MβCD-treated 30-hr ORN explant cultures were fixed and labeled with WGA (white in A–C; green in A′–C′) and an antibody to horseradish peroxidase (magenta in A′–C′) as a general neuronal marker. A, A′: As in previous figures, WGA labels small patches on axons in controls. Flattened growth cones exhibit very small patches (arrowhead in bottom right panel in A′). B: At 1 mM MβCD, there is a marked reduction in WGA labeling of axons. B′: Flattened growth cones exhibit larger WGA labeled patches (arrowheads), suggesting an aggregation of GSL-rich subdomains as sterols are removed. C, C′: At 2 mM MβCD, WGA labeling of axons is almost completely eliminated. C: WGA labeling persists in the cell bodies (bright labeling is edge of explant).
Figure 7
Figure 7. MβCD causes abnormal antennal lobe development.
MβCD injection at early stage 3, animals allowed to develop to stage 14 (A–C) or 18 (D). Midline to the left. Brains were double labeled with WGA (A–D) and with Jacalin (A′–D′ plus insets). A: Control – ORN axons terminating in the male-specific macroglomerular complex (MGC, consisting of the Cumulus (C) and Toroids 1 & 2 (T1&T2)) label with WGA; axons terminating in the ordinary glomeruli (*) do not. A′: Jacalin-labeled AL neuron dendrites arborize in a glomerular pattern in both ordinary and MGC glomeruli. (CNP): coarse neuropil. A′ (inset): AL neuron dendrites in an untreated AL chronically deprived of ORN axon innervation have a diffuse, aglomerular arbor. B: 5 mg MβCD. Male-specific ORN axons retain some WGA labeling, but both MGC and ordinary glomerulus organization is perturbed and lobes elongate. Bright WGA labeling of the lateral and medial cell body clusters (LC, MC) is due to high WGA affinity for a nuclear membrane protein . B′: Jacalin labeling highlights the disordered arrangement and lower number of glomeruli in treated animals. B′ (inset): In another animal injected with 5 mg MβCD, glomerulus-like structures appear even in the normally glomerulus-free coarse neuropil. C,D: 7.5 mg MβCD. Bright WGA labeling of MGC axons is completely lost though an MGC-like structure (MGC*) is present in panel C. C′,D′: Lobular structure of neuropil is faintly visible (arrowheads), but organization of the lobe is deeply perturbed despite the presence of substantial antennal nerves (AN). OT: output tracts. SZ: sorting zone region of the AN. Scale bar in A applies to all panels.
Figure 8
Figure 8. MβCD treatment dramatically reduces labeling for MFas II and perturbs the organization of MFas II-positive glomeruli.
A: Control AL from a stage-6 animal labeled with anti-MFas II (C3). ORN axons undergo dramatic changes in fasciculation and trajectory as they traverse the sorting zone (SZ); MFas II-positive and -negative axons segregate into relatively large distinct fascicles as they exit the SZ. A′: The same section labeled with the nucleic acid dye Syto 13 to show cell nuclei. Neuropil glial-cell processes extend partially around developing glomeruli and some glial cell bodies migrate into the neuropil between glomeruli (arrowheads). MC and LC: medial and lateral clusters of AL neuron cell bodies. B: 5 mg MβCD. With collection parameters identical to those used in panel A, a stage-6 AL displays almost no visible MFas II labeling (brightest glomeruli are indicated by arrows). B′, C′: Neuropil glial migration is somewhat reduced. C–F: Increased gain settings for the MFas II channel to visualize axon behavior. C: MFas II-positive axons in same AL shown in panel B show changes in trajectory and fasciculation that typically occur in the SZ, but then form glomeruli more variably sized than in controls. The large Fas II-positive, tightly fasciculated bundles normally present as the axons exit the SZ are absent and the axons traveling in the nerve layer are less tightly bundled. D, D′: 5 mg MβCD. Glomeruli from another animal are also smaller in size. Neuropil glial cells show minimal migration, but SZ glial cells have migrated into the antennal nerve (AN). E,E′,F,F′: 7.5 mg MβCD. Methanol/formalin fixation, no Triton permeabilization. Gain settings for E and F were increased as in C and D to permit visualization of residual Fas II labeling. Glomeruli are small and irregularly shaped. Numerous axons extended laterally and centrally past the main body of the Fas II-positive glomerulus-like structures. Few NP glial cells migrated while SZ glial cells displayed robust migration.
Figure 9
Figure 9. MβCD treatment of cultured ORNs decreases MFas II labeling.
A1–4: In control conditions, a subset of ORN axons extending from explants are MFas II-positive, some strongly (arrowheads), some moderately (open arrowheads). Arrows indicate several unlabeled axons visible under brightfield optics. B1–4: After 24-hr exposure to 1mM MβCD, more MFas II axons are moderately or only weakly labeled. C1–4: At 2 mM MβCD, nearly all MFas II-positive axons are only faintly labeled. Rare axons that appear brightly labeled (C3) were always less strongly labeled than those found in control or 1 mM dishes. No consistent changes were seen in axonal or growth cone morphology at the 1 mM dose; axon outgrowth was reduced at the 2 mg/ml dose.
Figure 10
Figure 10. MβCD treatment decreases neuroglian stabilization.
A,B: ALs of untreated brains show neuroglian labeling under two fixation paradigms. A: Standard paraformaldehyde fixation and Triton permeabilization produces labeling of ORN axons only in the SZ, the AL nerve layer and the glomerular layer, but not in the distal AN. B: Fixation with methanol/formalin demonstrates that neuroglian is also present distal to the SZ in the AN. C,D: 5 mg MβCD. Collection settings identical to those used in panels A and B, respectively. C: Standard fixation and permeabilization as in A. No neuroglian labeling is detected. D: Fixation with methanol/formalin. Neuroglian is present in the nerve and NP glial cells, though at lower-than- normal levels. D also clearly demonstrates that neuropil glial cells, while not migrating to surround glomeruli, did extend processes (arrows).
Figure 11
Figure 11. MβCD treatment modestly decreases neuroglian labeling in cultured ORN axons.
Under control conditions (A1–3), neuroglian labeling appears along the length of the axons and in the growth cones, including the filopodia (arrowheads), and most axons were brightly labeled. After 24-hr exposure to 1 mM MβCD (B1–3), labeling intensity was somewhat reduced but the distribution of labeling along the axon and in growth cones was unchanged. Exposure to 2 mM MβCD (C1–3) resulted in a further reduction in labeling intensity across the population although some axons remained brightly labeled (C1).
Figure 12
Figure 12. MβCD treatment blocks activation of EGF receptors.
A,B: Labeling with an antibody to the EGF receptor (red) that recognizes the receptor regardless of activation state. The receptor is present on ORN axons in both control (A) and MβCD-treated (B) animals. Glial cells beginning to form envelopes (arrowheads) around protoglomeruli in panel A. C,D: Labeling with an antibody to the activated EGF receptor (red) shows labeling in the SZ and developing glomeruli in controls (C), but not in MβCD-treated animals (D).
Figure 13
Figure 13. Blocking EGFR activation blocks neuroglian stabilization.
Control (DMSO) and PD168393-treated animals injected at early stage 5. A: Control – paraformaldehyde fixation and Triton permeabilization. Neuroglian labeling typical of stage-7 olfactory pathway. B: PD168393-treated animals processed as in A. Much weaker labeling, typical of that normally seen at late stage 5 or early stage 6 . C, D: Fixation/permeabilization by methanol/formalin results in strong neuroglian labeling in both controls (C) and treated animals (D), thus confirming the presence of neuroglian at normal levels. Gain settings were held constant in A and B, but decreased substantially for C and D because labeling was stronger under methanol/formalin fixation.
Figure 14
Figure 14. MβCD treatment of cultured ORNs decreases EGFR labeling.
Under control conditions (A1–2), punctuate labeling for EGFRs (using antibody ab49966) appears along the length of the axons and in the growth cones (arrows), including the filopodia (arrowheads). ORNs exposed to 0.5 mM MβCD for 24 hours display no discernable changes in morphology or labeling for EGFRs (B1–2).After 24-hr exposure to 1 mM MβCD (C1–2), the punctuate labeling of filopodia and axons is reduced but labeling of flattened growth cones remains. Exposure to 1.5 mM MβCD (D1–2) results in nearly complete absence of labeling of axons and filopodia; weak labeling of some growth cones persists. Scale bar in A1 applies to all panels except D2.
Figure 15
Figure 15. MβCD treatment does not prevent correct regional targeting of the axons innervating an identified glomerulus (glomerulus X).
Untreated (A–C) and MβCD-treated (D–F) animals. A,B: Stage 7. An antibody to human ankyrin B (yellow) labels ORN axons targeting a single glomerulus located dorso-posteriorly close to primary neurites of the medial cluster of AL neurons (outlined with dashed line). Neuronal cell bodies and glial nuclei labeled with Syto 13 (blue). C: Double labeling with the ankyrin B antibody (magenta) and the MFas II antibody (green) demonstrates that glomerulus X (arrow) is Fas II-negative. D–F: 7.5 mg MβCD, injected at early stage 3, brain dissected at stage 7. Ank B axons target a single glomerulus located near the primary neurites of the medial cluster of AL neurons although the shape of the glomerulus is variable and the pattern of fasciculation in the SZ is somewhat abnormal.

Similar articles

Cited by

References

    1. Gibson NJ, Rossler W, Nighorn AJ, Oland LA, Hildebrand JG, et al. Neuron-glia communication via nitric oxide is essential in establishing antennal-lobe structure in Manduca sexta. Dev Biol. 2001;240:326–339. - PubMed
    1. Oland LA, Tolbert LP. Key interactions between neurons and glial cells during neural development in insects. Annu Rev Entomol. 2003;48:89–110. - PubMed
    1. Tolbert LP, Oland LA, Tucker ES, Gibson NJ, Higgins MR, et al. Bidirectional influences between neurons and glial cells in the developing olfactory system. Prog Neurobiol. 2004;73:73–105. - PubMed
    1. Gibson NJ, Tolbert LP. Activation of epidermal growth factor receptor mediates receptor axon sorting and extension in the developing olfactory system of the moth Manduca sexta. J Comp Neurol. 2006;495:554–572. - PMC - PubMed
    1. Treloar HB, Purcell AL, Greer CA. Glomerular formation in the developing rat olfactory bulb. J Comp Neurol. 1999;413:289–304. - PubMed

Publication types